CORN Heist: Steal Short Profits Before Bulls React!🚨 CORN HEIST ALERT: Bearish Raid Ahead! 🚨 Swipe the Loot Before Cops Arrive! 🌽🔻
🌟 Attention, Market Bandits & Profit Pirates! 🌟
🔥 Thief Trading Intel Report 🔥
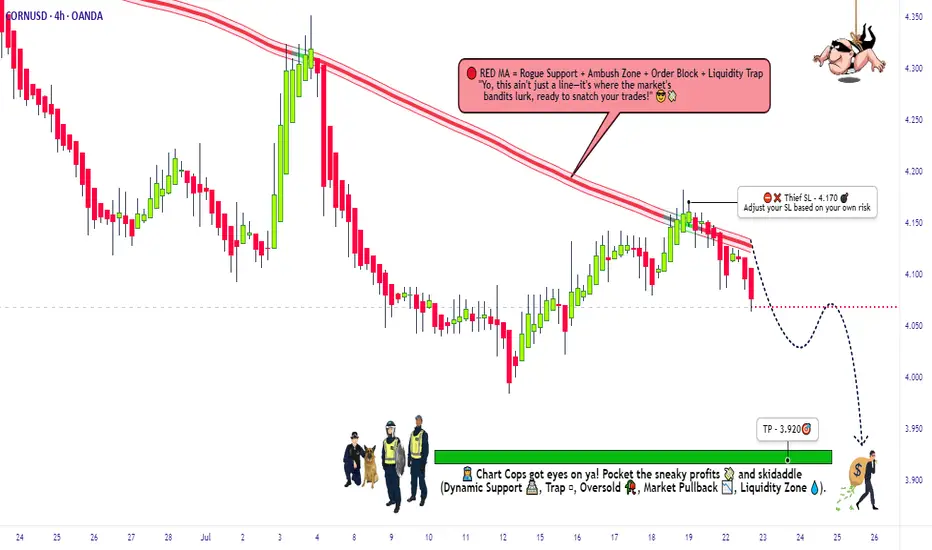
The 🌽 CORN CFD market is setting up for a bearish heist—time to short-swipe the loot before the bulls rally their defenses! Police barricade (resistance) is holding strong, but oversold conditions + consolidation hint at a trend reversal trap. High-risk, high-reward—just how we like it!
🎯 Heist Strategy (Swing/Day Trade)
Entry (Bearish Raid) 🏴☠️
"Vault’s unlocked! Swipe shorts at any price—OR set sell limits *near 15M/30M pullbacks for a cleaner steal!"*
Stop Loss (Escape Route) 🛑
Thief’s SL at nearest 4H swing high (4.170)—adjust based on your risk tolerance & lot size.
Pro Tip: Tighten SL if trading multiple orders!
Target (Profit Escape) 🎯
3.920 (or bail early if cops (bulls) show up!)
🌽 Market Snapshot: Why CORN is Ripe for a Raid
Neutral trend leaning bearish—consolidation breakout likely!
Key Drivers:
Macro pressure (USD strength, crop reports)
COT data hinting at big players positioning short
Seasonal trends favoring downside
Want full intel? 🔍 Check COT reports & intermarket analysis!
🚨 Trading Alerts (Avoid the Cops!)
News = Volatility Trap! 📰🚔
Avoid new trades during high-impact news.
Trailing stops to lock profits on running heists!
💥 Boost This Heist! 💥
"Like & boost this idea to fuel our next raid! More steals = more profits for the gang! 🏴☠️💰
Stay tuned—another heist drops soon! 🚀🤝
Cornshort
CORN SELL IDEACorn has been on a downtrend for some time and this bear market is yet to complete. From analysis I predict further from current zone to the green lined zones currently below market.
Trade at your own risk, I am not a financial advisor, just someone who shares ideas and planned personal trades!

Gotta Love Your CORN flakes, Tony 🐯Corn baby, CORN!!!
We have talked about Bitcorn, since Corn has been rising faster than Bitcoin.
We talked about pop-Corn and watching Corn rising like Superman
Well, it's time to stock up on your Kellogs people. This Price is going to 900 (check our previous idea below)
the CornProfessor
ps. this is my favorite breakfast: www.kelloggs.co.uk Thank you Tony, you make my mornings Corny and my trades profitable, I Love you Tiger

Corn Price has reached to its highest level since 2014Ascending channel in weekly chart is going to be broken soon, since RSI is 75, and RSI divergence has formed, technically we expect to see the price in lower levels soon but fundamentally it is still likely to go up to the end of march. But I doubt price goes up more than 600 since Argentina is going to terminate its export ban since the coming week and COVID-19 cases are going down gradually either in USA or China.

Corn Short Zone hello traders, Welcome back to the corn chart.
we have mentioned the reversal point of the price action of the Corn chart.
Thank you and Trade safe.....

Corn (big) SHORT3 way confluence with a massive Bat (with a much lower PRZ!) looming over this weekly chart!

Trading plan for CORN future - Short Strategy – ZC1The market goes back down but a major resistance could limit the fall
And don ‘t forget to take your profits…

Trading plan for CORN - Short Strategy – ZC1Zone Sell : 328
Target : 326
And don't forget to take your profits...

CORN FUTURES (ZC1!) DailyDates in the future with the greatest probability for a price high or price low.
The Djinn Predictive Indicators are simple mathematical equations. Once an equation is given to Siri the algorithm provides the future price swing date. Djinn Indicators work on all charts, for any asset category and in all time frames. Occasionally a Djinn Predictive Indicator will miss its prediction date by one candlestick. If multiple Djinn prediction dates are missed and are plowed through by same color Henikin Ashi candles the asset is being "reset". The "reset" is complete when Henikin Ashi candles are back in sync with Djinn price high or low prediction dates.
One way the Djinn Indicator is used to enter and exit trades:
For best results trade in the direction of the trend.
The Linear Regression channel is used to determine trend direction. The Linear Regression is set at 2 -2 30.
When a green Henikin Ashi candle intersects with the linear regression upper deviation line (green line) and both indicators intersect with a Djinn prediction date a sell is triggered.
When a red Henikin Ashi candle intersects with the linear regression lower deviation line (red line) and both indicators intersect with a Djinn prediction date a buy is triggered.
This trading strategy works on daily, weekly and Monthly Djinn Predictive charts.
This is not trading advice. Trade at your own risk.

CORN FUTURES (ZC1!) WeeklyDates in the future with the greatest probability for a price high or price low.
The Djinn Predictive Indicators are simple mathematical equations. Once an equation is given to Siri the algorithm provides the future price swing date. Djinn Indicators work on all charts, for any asset category and in all time frames. Occasionally a Djinn Predictive Indicator will miss its prediction date by one candlestick. If multiple Djinn prediction dates are missed and are plowed through by same color Henikin Ashi candles the asset is being "reset". The "reset" is complete when Henikin Ashi candles are back in sync with Djinn price high or low prediction dates.
One way the Djinn Indicator is used to enter and exit trades:
For best results trade in the direction of the trend.
The Linear Regression channel is used to determine trend direction. The Linear Regression is set at 2 -2 30.
When a green Henikin Ashi candle intersects with the linear regression upper deviation line (green line) and both indicators intersect with a Djinn prediction date a sell is triggered.
When a red Henikin Ashi candle intersects with the linear regression lower deviation line (red line) and both indicators intersect with a Djinn prediction date a buy is triggered.
This trading strategy works on daily, weekly and Monthly Djinn Predictive charts.
This is not trading advice. Trade at your own risk.

CORN FUTURES (ZC1!) MonthlyDates in the future with the greatest probability for a price high or price low.
The Djinn Predictive Indicators are simple mathematical equations. Once an equation is given to Siri the algorithm provides the future price swing date. Djinn Indicators work on all charts, for any asset category and in all time frames. Occasionally a Djinn Predictive Indicator will miss its prediction date by one candlestick. If multiple Djinn prediction dates are missed and are plowed through by same color Henikin Ashi candles the asset is being "reset". The "reset" is complete when Henikin Ashi candles are back in sync with Djinn price high or low prediction dates.
One way the Djinn Indicator is used to enter and exit trades:
For best results trade in the direction of the trend.
The Linear Regression channel is used to determine trend direction. The Linear Regression is set at 2 -2 30.
When a green Henikin Ashi candle intersects with the linear regression upper deviation line (green line) and both indicators intersect with a Djinn prediction date a sell is triggered.
When a red Henikin Ashi candle intersects with the linear regression lower deviation line (red line) and both indicators intersect with a Djinn prediction date a buy is triggered.
This trading strategy works on daily, weekly and Monthly Djinn Predictive charts.
This is not trading advice. Trade at your own risk.


Corn Sep 24 SHORTM pattern
Looking at our daily continuous corn contract we will first use our indicators such as RSI, Stoch RSI, and
MACD to determine possible directional position.
Or RSI is heading down the slightest but has been at this high level three major times with no success to
break through and has gone flat. Our Stoch RSI shows slight less buying pressure with the buy RSI above the sell
RSI, therefore still showing slight, not strong but still bullish presence.
Our MACD shows overbought conditions with our buy and sell looking to cross for selling pressure.
(Only 1 real bearish signs with a reasonable half bullish indicator.)
A 10R chart will show a more favorable move to the downside which will break it through the latest low.
an upside move using this technique is unlikely due to previous candle strength after Sep 17 drop.
We are in lower lows and lower highs pattern and are testing the third resistance touch with little strength
to break out.

Corn Short OpportunityBias: Downwards
- Monthly pinbar
- Look for price to test the 200 day moving average (red)
