Tesla - Confirmed BreakdownHello Traders, welcome to today's analysis of Tesla.
--------
Explanation of my video analysis:
For more than three years, Tesla stock has been trading in a bullish flag formation. Two months ago Tesla once again retested the upper resistance trendline and failed to break out towards the upside. There are two major support levels below current market price which I do expect Tesla to retest. Then you can absolutely consider long setups again on Tesla stock.
--------
I will only take a trade if all the rules of my strategy are satisfied.
Let me know in the comment section below if you have any questions.
Keep your long term vision.
Correction

Nasdaq (NQ1): The Grand Finale!Nasdaq (NQ1): CME_MINI:NQ1!
Examining the Nasdaq on the daily chart, it appears we may have indeed reached the final level of the potential primary scenario Wave 3 at the 461.8% extension, which is around $18,400. Now, we should be entering a Wave 4. If we continue to rise beyond this point, we might consider an alternative scenario where there is a bit more room to extend upward before developing Wave 5 as a Wave 5 extension, possibly around $19,500, marking our maximum in this scenario.
Thus, there are two scenarios, but we primarily lean towards the scenario that we are currently experiencing Wave 3, not Wave 5. Consequently, we anticipate a downturn to at least $15,500 minimum, up to a maximum of $14,140, the subordinate Wave ((iv)) level. This is the maximum level we expect to reach with Wave 4. We should definitely see a stronger corrective movement downwards before the final impulsive Wave 5 ascends. If we begin to see the first signs of weakness, we will consider establishing short positions on shorter timeframes, but until then, we will wait and observe.

The weekly on btcusd.An old trendline drawn on long-term cyclical lows, today seems like a good resistance where perhaps the price will have a small moment of pause, perhaps in the short term (3 weeks - 1 month). Last week's closing above the historical highs or in any case in that area also seems to give continuity to the bullish trend, but here now it is more important to try to understand the signals that could lead to a short-term correction or the more important one in the intermediate period. Understanding in time when the price will be in intermediate correction, as we have already seen in the past, becomes essential to recharge or get on the train which at this point only an unexpected catastrophe could stop. With this I don't mean to say that the time has come to sell, but quite the opposite, this is a good time to take advantage of a share for those who already have huge percentages in their portfolio, otherwise there is nothing to do, just wait for the possible corrections and buy. Today it's easier to say, it's true, I was lucky enough to get a lift in time which then proved to be the right one, except that if we didn't follow our experience, we'd be complete asses.

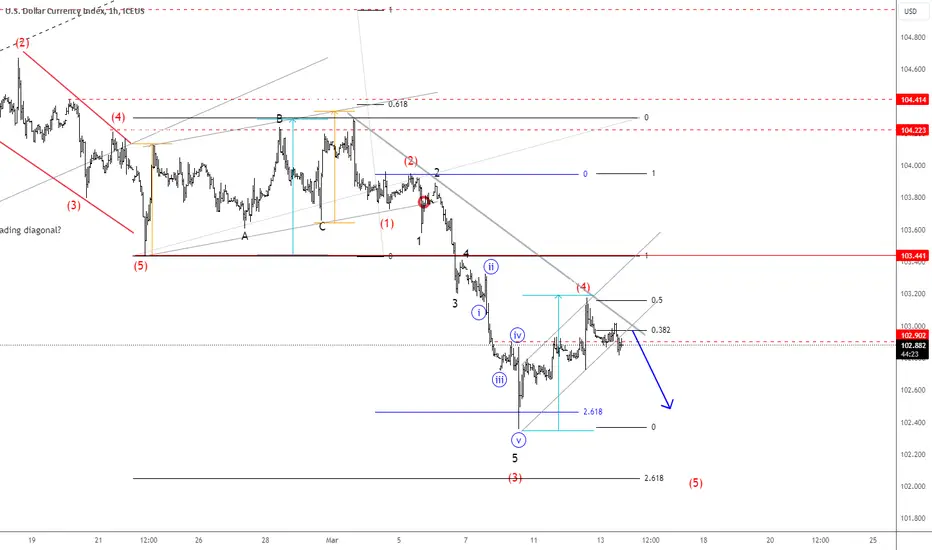
DXY Is Ready To Resume Lower: Elliott Wave Intraday AnalysisUSDollar Index - DXY is falling due to lower US Yields and we have been talking about that in the previous articles. There can be actually room for much more weakness, but on the intraday basis, we see room at least for one more leg down towards 102.00 level or lower.
We have seen some intraday recovery recently, but looks like a clear corrective movement in wave (4) from Elliott wave perspective, which can now send the DXY lower for wave (5).
Amazon - Break And RetestHello Traders, welcome to today's analysis of Amazon.
--------
Explanation of my video analysis:
In 2020 Amazon created a beautiful triangle breakout which was followed by a +75% rally and then a -50% correction. After the correction was over, Amazon perfectly retested a confluence of support and reversed aggressively towards the upside. Considering that Amazon just rallied 100%, I am now just waiting for a retest of the structure mentioned in the analysis.
--------
I will only take a trade if all the rules of my strategy are satisfied.
Let me know in the comment section below if you have any questions.
Keep your long term vision.

A purely speculative hypothetical cup & handle possibilityBitcoin just hit a new all time high against the USD pre halving! The bitcoin spot etfs have shifted the paradigm and we now find ourselves in unprecedented times. Considering that, for all I know the correction may have already seen the lowest it will go before we resume bull, but if history can tell us anything, it’s that it’s very common to see multiple 30-40% dips here and there during the bull market and this very well could be the beginning of one of those corrections. If so, a 40% dip could take price roughly back to the 40k one,, which would be a convenient zone for it to correct to as it would likely retest the weekly 50ma there as they would probably be both arriving at 40k around roughly the same time, that would be an excellent place for a bounce, of course should a black swan event occur sometime near there we could even see an unexpected flash crash wick even further below that maybe even 50-60% but the probability of something like that is much much smaller. If we were to correct the usual 30-40% or even let’s say we start having diminishing corrections and only correct 15-25%, in doing so, we will actually be simultaneously forming a handle to the text book picture perfect cup bitcoins price action just finished forming once it reached the new ath. Because of the possibility of such a hypothetical scenario currently being in. Play,I went ahead and drew a rough guesstimating of what I would expect the handle to look like should we form one here. Again, this is a completely arbitrary guesstimate, so if we do form one, it could be much smaller than the one I’ve randomly drawn here in red. Whether it takes shorter or longer for us to finish the handle if one does form, should not alter the potential breakout target that it would have by much, and as we can see if we broke out around the time the rough estimate one I have drawn ends the target should be well over 120k. Because of the zone where price action has recently gone and now been rejected from is so close to our previous ath zone, we also now on the bearish side of things have. Potential triple top in play. We went up in price at such. Fast and hyperparabolic rate that the argument for this being the bull markets blow off top is actually a possibility, a very slim, low probability possibility, but still a possibility none the less, in which case, the triple top argument is able to at least be a possibility. Which is perfect for the whales and market makers because that will sew just enough uncertainty in the market that when we do get to the bottom of the current correction you will probably have permabears coming out of hibernation to claim the bull market top is already in and we are going much lower. However, I personally don’t think the top is in because we never got the signal on the pi cycle top indicator. I plan on taking d vantage of any correction we get here by accumulating, laddering in small buys around 20%, 30% , and then slightly bigger buys at 40% if we get it. Also if we’re lucky enough to get some sort of 50-60% flash crash from a black swan I will ladder in even bigger buys then as well. If somehow we were to get a flash crash that went as deep as 80% - 90% at that point then I would have to consider that it was a bull market top, however that would then mean that the follow up bear market freeware’s would be extremely short lived and we’d be right back into the bull market. High has never happened before, but hey, with thee new bitcoin spot etfs approved a lot of unprecedented price action is suddenly possible. Again this whole cup n handle idea in the first place isnt set in stone yet and theres. Chance we’ve already had our full correction even. I think judging by the past in btc’s history, the most likely thing to occur here though would be a 30-41% correction. *not financial advice*

Microsoft: Strategies for Correction 🛠️Microsoft (MSFT): NASDAQ:MSFT
We remain steadfast in our primary scenario for Microsoft , which suggests a significant correction is underway. Thus far, there have been no deviations from this expectation.
Upon closer examination of the 2-hour chart, we observe that the subordinate Wave (B) precisely reached our targeted 127-138% retracement levels. We now anticipate a similar overshooting movement downwards, surpassing Wave (A), towards Wave (C), and subsequently the overarching Wave (a).
Unless we breach the $420 to $422 level, we do not foresee a continuation of the upward trend. A broader view on the two-day chart indicates that Wave 5 should ideally conclude at the 61.8% extension, implying a possible rise to $430. However, this is not certain. If we are experiencing a flat correction, the outcome could exceed this level depending on the origin of Wave A. Nonetheless, a subsequent downturn should be expected unless we surpass the corresponding 138% level.
The precise location of the 138% marker remains undetermined until we establish the position of Wave A, which we currently project to align with Wave 4, around the $160 to $175 level.

XVS Cryptocurrency Analysis: Uptrend Continuation or Correction This analysis examines the current state of the XVS cryptocurrency and assesses its potential future direction.
Technical Analysis:
Battling Weekly Resistance: XVS is facing a significant hurdle at the weekly resistance level, which could determine the course of its future trend.
Escaping the Accumulation Box: The recent breakout from the daily accumulation box marked a notable 80% surge.
Insufficient Rest Calls for Correction: The current uptrend lacks sufficient retracement, which is typically necessary for sustained upward momentum.
Key Support and Resistance Levels:
Support: The blue trendline support acts as a critical barrier, with a breach potentially leading to a retracement towards the previous weekly resistance.
Resistance: The next weekly resistance level presents a significant obstacle for further upward movement.
RSI Indicator:
Overbought Territory: The RSI indicator is approaching the overbought zone, suggesting a potential correction.
Momentum Confirmation: A break above the overbought threshold could signal strong upward momentum.
Lower Timeframe Analysis:
4-Hour Timeframe: A more detailed analysis on the 4-hour timeframe provides a clearer picture of the current price action and potential support and resistance levels.
Conclusion:
The XVS cryptocurrency is at a critical juncture, with the outcome of the battle at the weekly resistance level determining its future direction. A correction is likely before further upward movement can occur. but considering decreasing the volume the out come might be different.
This analysis is for educational purposes only and should not be construed as financial advice. Always conduct your own research and employ sound risk management practices before trading.

Bitcoin Long-Term Analysis: Bullish Breakout or Mid-Bull Market Bitcoin Long-Term Analysis:
The chart illustrates Bitcoin's (BTC) monthly price action within an ascending channel since 2017. The red vertical lines indicate instances when the monthly RSI entered the overbought zone, historically coinciding with mid-bull market phases.
At $75,000, BTC will encounter the channel's midline . A breakout and consolidation above this area could propel the price towards the channel's upper trendline, potentially reaching $300,000 depending on the timing of .
Currently, most indicators on lower timeframes show overbought conditions, suggesting a probable correction after BTC reaches the channel's midline. Further analysis on lower timeframes will provide more insights into potential corrective movements.
Please note: All analysis provided here is for informational purposes only and should not be considered investment advice. You are solely responsible for any investment decisions based on this information.

MINA Analysis: Potential Correction, SELL or BUY Setup?!🍣📈Weekly Channel Breakout and Retest:
MINA previously broke out of its weekly channel and reached its target successfully.
The recent breakdown below the channel indicates a loss of bullish momentum and potential for a retracement.
🔍📉Corrective Phase and Resistance Levels:
If MINA undergoes a correction, it is likely to retrace upwards until reaching its weekly resistance level.
A rejection at this resistance level, coinciding with the RSI reaching the daily blue resistance line, could present a selling opportunity.
🚫Early Sell Setup and Risk Management:
A sell position could be initiated early at the current price level (below the lower channel line) using the red trigger line as confirmation.
Trailing the stop-loss to the lower support zone can help mitigate risk and maximize profit potential.
✅Important Considerations✅
The overall market trend should be taken into account before executing any trades.
Confirming the reversal with additional technical indicators and market sentiment analysis is essential.
🚫This analysis is for educational purposes only and should not be construed as financial advice. Always conduct your own research and employ sound risk management practices before trading.
🚫

Apple Market Analysis (AAPL): Evaluating Potential Scenarios 📉 While we're not ones to conjure doomsday scenarios or firmly believe in them, it's undeniable that some charts, stocks, commodities, etc., have the potential to plunge significantly.
Apple NASDAQ:AAPL is one such example. It's essential to clarify that we don't primarily anticipate a 40 to 50 percent drop in Apple's stock price. However, we must acknowledge the possibility.
🔎 Our primary analysis suggests we're dealing with an overarching Wave (3) (in blue) and currently in Wave (4). The question is whether Wave (4) has already concluded at the $124 level with a zigzag-flat movement, or if we might dip lower for Wave (4). There are two possibilities, especially since Wave 1 aligns precisely with the 127 percent level, which is the target for an Expanded Flat. The structure towards the red Wave 1 doesn't distinctly resemble a 5-wave pattern, keeping the second scenario very much in play. If this occurs, we expect prices to reach at least $124, potentially dropping further towards $100.
If we assume that it's indeed a Wave 1, lying coincidentally around $200, we might be dealing with a normal flat structure. Both Wave ((a)), showing a triple structure, and Wave ((b))are at the level of Wave 1, leading us to anticipate Wave ((c)) reaching the level of Wave ((a)). However, a deeper fall is still plausible, ideally stabilizing at the 61.8% level. Anything below this would significantly alter the potential Wave (4) scenario, and we would wait accordingly.
✅ Over the next days, we'll continue to monitor the chart, ready to send out a limit order for this setup if it materializes.
📉 Looking at the potential doomsday scenario, particularly a possible Wave II. This Wave II could reach between 50 and 78.6%. Assuming Wave A as Wave II, as shown, is quite a gamble since it doesn't even reach 38.2% of the total course since 2009. Also, Wave B, as an overshooting wave, precisely hits the 127% retracement from Wave 5 to Wave A, suggesting an extended Wave II correction.
📈 If, however, we surpass $205, this scenario becomes invalid, indicating a continued upward trend. Unless we break this level, there's still a possibility of dropping below $100, a precarious position for Apple. But then, as this is part of Wave II, a significant, long-term rise for Wave III should follow. Whether this happens remains to be seen in the coming months, laying the foundation for either a downward correction or a continued uptrend.

Bitcoin Slows Down For A Higher Degree A-B-C CorrectionBTCUSD hit projected target area for wave III and it's now turning down after the BTC spot ETF approval, ideally within a higher degree wave IV correction before the uptrend for wave V resumes. Looking at the 4-hour chart, we are tracking a three-wave A-B-C corrective setback that can retest 40k-38k support area, so after wave B recovery, watch out for more weakness within wave C.

Analysis of Gold on the 12-hour Time FrameAfter a strong upward movement, gold has reached the resistance range of 2140 - 2148 significantly. It seems like it's time for a correction now.
If gold wants to correct due to today's news, we can set our target at 2090, which is an important support level for gold.
Gold Support: 2080.5 - 2088
Gold Resistance: 2140 - 2148
And the price of 2120 determines the market boundary.
Today-tomorrow there will be quite strong news, all focus on Fed Chair Powell. Discussions on interest rates, inflation, and other factors are likely. Given the overall situation in the US, there is a chance that the dollar will receive more support, potentially impacting gold negatively.
Gold might make another move upwards based on the news and touch the resistance zone before starting a downward movement.
Recommended Positions:
Sell: 2142 - 2148
No need for a stop-loss
Short-term Target: 2121 - 2090
Long-term Target: 2060 - 2033
Buy Short-term (Scalp): 2088 - 2085
Stop-loss: 2081
Target: 2094 - 2096 - 2100

Nasdaq - Now Is The TimeHello Traders, welcome to today's analysis of Nasdaq.
--------
Explanation of my video analysis:
For more than 10 years the Nasdaq has been trading in an obvious rising channel formation and retested the lower support the last time in 2023. This retest was followed by an expected 65% pump. Considering that Nasdaq is now retesting resistance as mentioned in the analysis, I do expect a short term pullback to retest the next support level below current market price.
--------
I will only take a trade if all the rules of my strategy are satisfied.
Let me know in the comment section below if you have any questions.
Keep your long term vision.

BTC new ATH and CorrectionHello everyone, let's take a look at the BTC to USDT chart on a one hour time frame. As you can see, the price dynamically moved lower from the local upward trend line.
Let's start by determining the support and as you can see, the price is in the support zone from $62,971 to $61,218, and may continue to stay around $58,999.
Looking the other way, you can see resistance at the level of $64,493, then the second one at $66,360, and then a very strong resistance zone from $67,691 to $69,349, where the price described the new ATH.
Looking at the RSI indicator, you can see a local downward trend line, with room for a larger correction, while on the STOCH indicator we are approaching the lower limit but a possible downward movement is still visible.

BA- Buy the recovery? or take partial profits? LONGBoeing had a near disastrous start to 2024 with a Malaysian part falling off a MAX jet at 36,000.
Incidentally, going viral is that an iPhone survived the plunge fully functional. 20% got
shaved off the market cap. I bought the low with calls at $215 expiring March 15'24. They did
80% for the week and 16% today. News catalysts are that an East Indian airline company placed
a contract for the purchase of 100 jets of uncertain model. Delta Airlines also did not pull their
existing contract. These catalysts have allowed price to recover about 1/3 of the plunge. The
15-minute chart demonstrates the super trend reversal better than the 60 minute which is
shown here on the idea. The relative volume indicator is about 3 X the running mean showing
trader interest uptick. BA could short squeeze where short sellers quickly buy to cover &
capture profit while the synergistic rise is compounded by near buyers coming in to get ahead
of the chasing? The caution is that the POC line on the intermediate
term volume profile is $ 210 and so getting contracts extended above that has increased
risk based on price distance from the POC. The uptrend instead of a true recovery could be
simply a correction in the overall downtrend. I will take some of the week's profit off
the table and keep a close watch on the price action.

DAX Forecast: Exploring Wave Patterns and Correction Scenarios🌍German DAX Analysis
Taking another look at the German benchmark index, the DAX XETR:DAX , our scenario remains unchanged. If we don't breach the 18,000 EUR mark, we anticipate continuing with Wave IV, which is expected to range between 10,000 € and a maximum of 7,500 €, depending on the potential overshoot of Wave (B).
This scenario will be invalidated if we surpass the 138 % level.
Zooming into the 4-hour chart, we observe the formation more closely, potentially shaping Wave ((b)) that is currently in development. The 1-hour chart gives us an even closer view, indicating we are precisely in this phase of Wave ((b)). Crossing over 17,218 € would likely invalidate our current scenario, prompting a reevaluation of where Wave (B), marked in blue, could be located—potentially moving towards 17,500 € or up to 18,000 €.
Should there be a turn at this juncture, we might see a flat correction, an overshooting flat moving down towards Wave ((c)) or Wave 1. After reaching the 127-138 % range, this phase should conclude with a 5-wave cycle downwards.

✅AUD_JPY GROWTH AHEAD|LONG🚀
✅AUD_JPY is trading in an
Uptrend and the pair is
Making a local bearish
Correction but will soon
Retest the horizontal
Support level of 98.518
From where I think we
Will see a bullish rebound
And a move up
LONG🚀
✅Like and subscribe to never miss a new idea!✅

#DXY possible bullish reverse head and shoulder patternI believe this bearish move, which we are observing in the 1-hour timeframe market structure, is a bearish corrective move. Consequently, there is a possibility of a bullish continuation move in the Dollar.
Upon closer inspection, we can see the formation of a reverse head and shoulder pattern , which is an intrinsically reversal pattern and signals a potential bullish move.
If the price manages to break above this bullish pattern and a short-term bearish trendline, we could assume that our higher timeframe bullish move would possibly continue.
If you've found this analysis helpful, please take a moment to like, comment, or share your thoughts with me.

ALTcoins May Face Further RallyALTcoins are still dominating in the Crypto market. Looking at TOTAL3 crypto market cap chart, which excludes Bitcoin and Ethereum, we can clearly see a bullish pattern. After a complete complex W-X-Y correction in wave (4), we can now see an impulsive minor five-wave recovery, which can be first wave 1 of a higher degree wave (5), so after a pullback in wave 2, watch out on further rally into wave 3 of a five-wave bullish cycle, especially if breaks channel resistance line near 500B level.

ADA Long IdeaWaves 1&2 Completed...3rd Impulse Wave is retracing. A lot of higher highs shows Bull Activity. Pattern shows a strong Trend and a bullish Divergence, Limit 0.62

XRP WILL PUMP WITHIN 2 WEEKS!!Looks like a massive pump will come withing the next 2 weeks here. The descending trendline price compression is slowly coming to an end.
I EXPECT HIGHER PRICES IN THE LONG-TERM STILL BULLISH!
Calculate Your Risk/Reward so you don't lose more than 1% of your account per trade.
Every day the charts provide new information. You have to adjust or get REKT.
Love it or hate it, hit that thumbs up and share your thoughts below!
This is not financial advice. This is for educational purposes only.

AUD-USD Resistance Ahead! Sell!
Hello,Traders!
AUD-USD made a rebound
From the horizontal support
Of 0.6447 and went up
Sharply so after the pair
Retests the horizontal
Resistance level of 0.6541
I believe we will see
A local bearish correction
Buy!
Like, comment and subscribe to help us grow!
Check out other forecasts below too!
