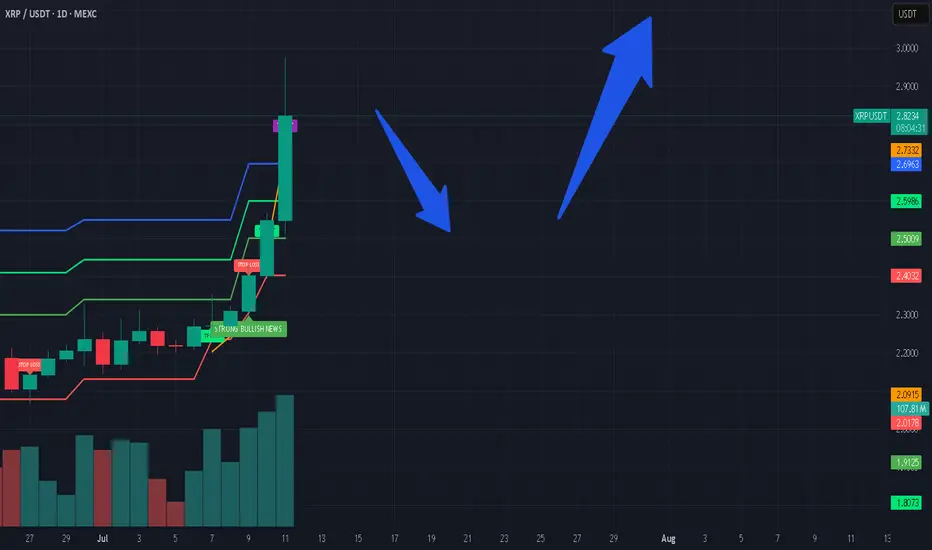
XRP is making moves!Will it break $3, or drop back to $2? Previous Cycles showed that a correction might be next in line for the crypto market as a whole. Which means, if it happens, altcoins will get affected a lot...Do not get shaken out, after the correction expect a huge rally, but for now...it might be a perfect point to secure some profit.
Not investment advice.
#xrp #bitcoin #crypto #short #analysis
Correction
Ethereum can make a small correction before it continues to growHello traders, I want share with you my opinion about Ethereum. After a long period of consolidation within a descending triangle, Ethereum broke out and started forming a steady upward channel. The impulse move from the buyer zone gave the market fresh bullish energy. We saw the price pushing through key resistance levels, showing strong momentum and confidence from buyers. Eventually, ETH reached a local peak and is now hovering just above the current support level at 2835. This area is crucial - it previously acted as resistance and has now turned into a support area, giving bulls a chance to regroup. Based on the structure, I expect a short-term correction toward the support area, followed by a continuation to the upside. The trend remains strong, and the impulse is not yet exhausted. That’s why I set my TP at 3240 points, which aligns with the upper expansion target based on previous movement. Given the breakout, strong uptrend, and support zone now being retested, I remain bullish and anticipate further growth from the current levels. Please share this idea with your friends and click Boost 🚀
Disclaimer: As part of ThinkMarkets’ Influencer Program, I am sponsored to share and publish their charts in my analysis.

Crypto Market Completes A Correction Within Bullish TrendGood morning Crypto traders! We got a nice bounce and recovery in the Crypto market along with stock market rally after US President Donald Trump announced that Iran and Israel had agreed to a ceasefire, calling the conflict “The 12-Day War.”. Crypto TOTAL market cap chart now shows that correction is completed, support is in place and bulls back, so more upside can be seen in upcoming days/weeks, just be aware of short-term intraday pullbacks.

Euro will make correction to support line of channelHello traders, I want share with you my opinion about Euro. In this chart, we can see how the price entered to triangle, where it at once bounced from the support line and rose to the 1.1100 support level, which coincided with the buyer zone. Soon, price broke this level, after a small correction, and continued to move up to the 1.1575 current support level, which coincided with the support area. This area also coincided with the resistance line of the triangle, and the Euro rebounded from this line and started to decline. In a short time, it declined to the buyer zone, where it turned around and started to move up. Soon, Euro exited from triangle and continued to rise inside an upward channel, where it made a correction first and then continued to grow. Later, EUR rose to 1.1575 current support level, one more time and even almost broke it, but failed and corrected. But soon, it finally broke this level and rose to the resistance line of the channel, where at the moment it continues to trade near. In my mind, Euro will rebound from this line and go to the correction until to support line of the channel, breaking the support level. For this case, my TP is located near this line - at the 1.1490 points. Please share this idea with your friends and click Boost 🚀
Disclaimer: As part of ThinkMarkets’ Influencer Program, I am sponsored to share and publish their charts in my analysis.

XRPBTC May Face Another Rally This YearXRPBTC pair can be trading in a larger weekly (A)(B)(C) flat correction, where wave (C) can be now in progress as a five-wave bullish impulse back to 2021 highs.
XRPBTC is currently slowing down due to BTC dominance, but notice that it's now testing February 2025 lows, so wave 4 correction can be coming to an end, which can extend the rally for wave 5 of (C) towards 0.000040 area and it can bring the ALTseason.

GBPJPY Keeps Recovering, But It’s Approaching ResistanceGBP/JPY is on the rise but is approaching the upper boundary of the 2024–2025 range, which could present strong resistance around the 200 level. Keep in mind that the decline from the 2024 highs to the July lows near 180 was impulsive, while the current rebound appears slow and corrective—possibly a wave B within a flat correction or even part of a triangle formation. In either case, we believe some further sideways price action is likely, followed by a potential downward turn from this prior subwave A resistance zone.

Big CorrectionThe S&P index.
The chart shows the potential end of the final rally from the 2009 low.
Currently, with this rally from the recent 4,800 low, we are still in a correction period that will end in late October (highs and lows are irrelevant), & We have a date coming up in August so let's see what happens there.
After this period, we will have a rally combined with uncertainty and unjustified speculative movements (bubble) that could take us to the final peak, which I expect in 2026.
This remains a possibility, but don't base your trades on it. However, caution is often good.

ETH READY TO GO 3000$ ???🔍 ETH/USDT Analysis – Daily Timeframe
ETH is currently trading at $2,427, holding above the key support zone around $2,370 - $2,390, which is aligned with the 100 EMA. This zone has acted as a strong accumulation area.
📈 Market Structure:
Price is consolidating inside a horizontal range. A confirmed breakout above the resistance zone ($2,650 - $2,700) could lead to a bullish continuation towards the major resistance at $2,861.
📊 Technical Outlook:
Trend: Sideways range (accumulation phase)
100 EMA: Acting as dynamic support
Breakout Potential: Bullish continuation expected on breakout and retest
📌 Trade Plan (Not Financial Advice):
Entry Idea: Break and close above $2,700 zone
Target: $2,861 and higher
Invalidation: Daily candle close below $2,370
ETH is building strength above its 100 EMA. A breakout from this range can trigger a fresh bullish leg.
🔁 Like & share your opinion! Always DYOR before trading.

Litecoin Is Forming A Bullish PatternLitecoin with ticker LTCUSD made nice and clean five-wave recovery back to 100 area in the 4-hour chart, which confirms support in place and bullish reversal, so it can be a higher degree wave (1), thus more upside is expected for a higher degree wave (3) after current complex W-X-Y correction in wave (2) that can be in final stages. First support is here around 90-85 area, while second deeper one would be at 80 area.

Bitcoin Pushed Crypto Market Into A Higher Degree CorrectionGood morning Crypto traders! Cryptos are coming lower and we can now see a five-wave drop on Bitcoin, which indicates for a deeper, higher degree correction, so Crypto TOTAL market cap chart may stay in consolidation within an ABC correction, which can retest 3.0T – 2.8T support zone before bulls return.
Bitcoin has impulsive characteristics on 4h time frame, and we can clearly see five waves up that can send the price even higher after a pullback. Now that it’s back to all-time highs, we can see it making a higher degree ABC correction, which can take some time, and it can retrace the price back to 97k-93k support zone before a bullish continuation.
However, we may now see a temporary corrective recovery in wave B, where some ALTcoins could still be doing well, if we consider that ALTcoin dominance may start kicking in. Yesterday we shared a chart of the ratio of TOTAL3(ALTcoins) market cap against Bitcoin with ticker TOTAL3ESBTC, which shows that ALTcoins may start outperforming BTC soon. It can be finishing final subwave C of (Y) of a correction in blue wave B which may cause a new strong rally into wave C that can bring the ALTseason similar as in the beginning of 2021.

Euro will correct a little and then continue to move up nextHello traders, I want share with you my opinion about Euro. Observing this chart, we can see how the price entered to upward channel, where it at once dropped from the resistance line to the support line and then started to grow. In a short time price rose to the 1.1210 level, broke it, and even rose a little more, but soon turned around and declined to the support line of the channel. Then the Euro made an upward impulse, and then broke the 1.1210 level one more time and continued to grow inside the channel. Later price reached the resistance line of the channel and then corrected, after which, in a short time rose to the support area, breaking the 1.1400 level. But soon the price turned around and dropped to the 1.1210 level, thereby exiting from channel. Next, Euro continued to grow inside the wedge, where it rose to the current support level and soon broke it. After this, the price rose to the resistance line of the wedge and then corrected, after which it made an upward impulse. Price exited from the wedge, and now I think that the Euro can make a correction, after the rise, and then continue to grow next. That's why I set my TP at 1.1560 points. Please share this idea with your friends and click Boost 🚀
Disclaimer: As part of ThinkMarkets’ Influencer Program, I am sponsored to share and publish their charts in my analysis.

LDO - Next Impulse Starting Soon!Hello TradingView Family / Fellow Traders. This is Richard, also known as theSignalyst.
After breaking above the $0.8 major high, LDO has shifted from bearish to bullish from a long-term perspective. 📈
This week, it has been undergoing a correction phase within a falling channel marked in red. 🔻
For the bulls to take over and kick off the next impulsive wave toward the $1.5 mark, a breakout above the upper red trendline is needed. 🚀
📚 Always follow your trading plan regarding entry, risk management, and trade management.
Good luck!
All Strategies Are Good; If Managed Properly!
~Rich

USDollar Is Making An Intraday Pullback Within DowntrendGood morning traders! Stocks keep pushing higher along with yields, so it looks like 10Y US Notes could still see lower support levels, and that’s why USdollar is in a bigger intraday correction. What we want to say is that while the 10Y US Notes are still searching for support, the DXY can stay in recovery mode or at least sideways. In the meantime, stocks can easily see even higher levels after NVIDIA surpassed earnings.
Looking at the intraday USDollar Index – DXY chart, we see a leading diagonal formation, so we are tracking now an intraday abc correction before a bearish continuation, thus keep an eye on GAP from May 18 around 101 level that can be filled and may act as a resistance before a bearish continuation.

Crypto Market Slows Down For A Correction Within UptrendCrypto market nicely slowed down as expected and Crypto TOTAL market cap chart can now be finishing a projected wave 4 correction right at the former wave "iv" swing low and channel support line, which is ideal textbook technical picture that can now send the Crypto market higher for wave 5, especially if bounces back above 3.3T area and channel resistance line.
However, even if it's going to face deeper and more complex correction within higher degre wave (2) down to 3.0T - 2.8T area, sooner or later we can expect a bullish continuation, as Crypto TOTAL market cap chart is not at the all-time highs yet.

Bitcoin Short-Term, Aims Below $100,000 (Alert!)Good morning my fellow Cryptocurrency trader, overall, the market looks great.
The market looks great but never forget that nothing is set in stone, market conditions can always change.
Let's consider Bitcoin for once on the short-term timeframe.
The long-term timeframes are good to spot the bigger cycle; the smaller timeframes are good to know what will happen next.
— Bitcoin 4H TF (Short-term)
Bitcoin hit a new all-time high and was followed by a strong bearish volume session. The action went on to move below a strong resistance zone, the ath range.
Now Bitcoin is trading below "local resistance" and this opens up a bearish bias short-term. When it moves back above $110,000, we can say the bulls are back in. When it trades below $106,000, we can say bearish confirmed.
Here we can see Bitcoin bearish while aiming lower.
If it continues dropping, 100K won't be the end. Either it recovers now, or else we will see a test of the low 90Ks.
Leave a comment if you agree.
Follow if you disagree.
Thank you for reading.
Namaste.

Just a Thought: What If the Big Bull Run Starts Next February?Chart: SOLUSDT Perpetual (1W)
Let’s play devil’s advocate for a second…
📉 What if:
The most recent pullback from Solana’s all-time high wasn’t just a dip to find support, but a high timeframe market structure break (MSS)?
We wicked right into the Point of Control (POC) at $126, a critical level going back to Solana’s inception. Many saw that as a liquidity sweep, which it is, but what if that break was confirmation of a shift in the macro structure?
Since then, we’ve seen a corrective rally, and as of now, price is approaching the golden pocket (0.618–0.65) around the $200 region coupled with time Fib confluence around June 25.
⚪ The ABC Hypothesis:
There’s a clean potential for an (A)-(B)-(C) correction. If the market can’t push through the $200 resistance in June, we could see a dragged out move down into the 1:1 extension, which interestingly aligns with key monthly naked POCs (MNPOCs) at $73 and $41, and specifically the 1:1 at $49 (highlighted on the chart for September 25).
That would create a textbook ABC correction, where:
• A = drop from ATH to MSS
• B = golden pocket retracement
• C = 1:1 extension, sweeping long-term liquidity
📅 What if the real bull run doesn’t start until Feb 2026?
Everyone’s calling for the big breakout this year… but what if we need one last washout to fully reset? That timing aligns eerily well with early Q1 2026, after a final leg down.
Chart Legend:
• ✅ Green line = current price
• 🔴 POC = Point of Control (macro volume node)
• ⚪ White lines = ABC structure
• 🔵 Blue verticals = time-based Fibonacci
• 🟡 Golden Pocket = 0.618–0.65 retracement
• 🟣 MNPOC Levels = untested monthly points of control
Just a theory. Not advice. DYOR.
What do you think? Could the real reset be coming?

SEI Turns Bullish After A Zig-Zag CorrectionSEI Turns Bullish After A Zig-Zag Correction, as we see it sharply bouncing from projected support that can send the price higher by Elliott wave theory.
SEI with ticker SEIUSD is waking up exactly from the channel support line and equality measurement of waves A=C, which is perfect textbook support for subwave (5) of an impulse into wave C of an ABC zig-zag correction. It's actually nicely and impulsively rising for wave 1, so after current wave 2 pullback, be aware of a bullish continuation within wave 3 of a five-wave bullish cycle, especially if breaks above 0.30 first bullish evidence level.
Sei (SEI) is a high-performance Layer 1 blockchain designed specifically for decentralized finance (DeFi) and decentralized exchanges (DEXs). Launched in August 2023 by Sei Labs, it features innovations like Twin-Turbo Consensus for fast block finality, Optimistic Parallelization for high throughput, and SeiDB for efficient transaction handling. It supports EVM compatibility, enabling seamless deployment of Ethereum-based apps. The SEI token is used for transaction fees, staking, governance, and liquidity.

HSBC (HSBC) – $54 Risk Zone if ABC Correction Is Triggered HSBCHSBC is currently trading within a rising wedge, but a potential short-term drop of approximately 5% could trigger a full ABC correction pattern. This scenario is not confirmed yet, as the chart remains structurally bullish.
However, should the price reverse and break below the rising channel, it would likely mark the start of wave C, completing an A-B-C corrective sequence. This development could lead the price toward the $54 support zone, which aligns with a previous demand area.
While there is no immediate breakdown or weakness, traders should remain alert. A simple -5% drop might be all it takes to activate the next phase of correction.
Pattern: Potential ABC correction
Trigger: 5% decline from current levels
Target: $54
Bias: Neutral – watch for reaction if price softens

Gold Completes A Correction Within Bullish TrendGold made another sharp leg to the upside in first half of April, even showed some accelerating price action away from the 3,000 level. This suggests it might have been part of wave three when looking at the Daily and 4-hour time frame, so there can be more upside within a much more extended impulse structure. Possibly already now after blue wave four consolidation shows first signs of a bottom near 3120. Notice that pullback from recent high is in three legs, while price recovered out of wave (C) channel, so looks like new recovery is in the cards.

Silver Finds Its Footing—Are the Bulls Back? (Elliott Waves)Silver rebounded quite aggressively in April, following Trump’s decision to impose a 90-day tariff pause. At the time, there was still a lot of uncertainty, so many investors turned to metals as a safe haven—particularly during periods of trade tensions.
More importantly, we can see silver forming five waves up from the 28.34 low. In Elliott Wave terms, when we see a strong directional move that can be counted in five waves, it often represents the beginning of a new trend. That means the current pause is likely just a correction, and more upside should follow.
The 31.00–31.50 area is a very interesting support zone for silver—an area from which we could see a rebound, possibly after a completed A-B-C setback from the 33.70 region.

Bitcoin can drop from wedge to 100K pointsHello traders, I want share with you my opinion about Bitcoin. After consolidating for an extended period within a triangle pattern, the price eventually broke out with strong bullish momentum. The move was supported by a solid rebound from the buyer zone and a clean breakout above the 92800 - 94200 support area. This breakout initiated a steep climb, forming a new upward wedge structure, defined by narrowing trend lines and rising local highs. Currently, the price is trading near the resistance boundary of the wedge, around the 104000 - 105000 zone. This zone has already triggered one rejection and is showing signs of weakening bullish strength. Given the rising wedge geometry and the fading impulse strength, the risk of a correction is increasing. The current structure typically leads to a pullback, especially after such a steep rise. I expect that BTC may rise to the resistance line of the wedge and then drop below the support line, thereby exiting from this pattern. That's why I set my TP 1 at the 100K points. Please share this idea with your friends and click Boost 🚀

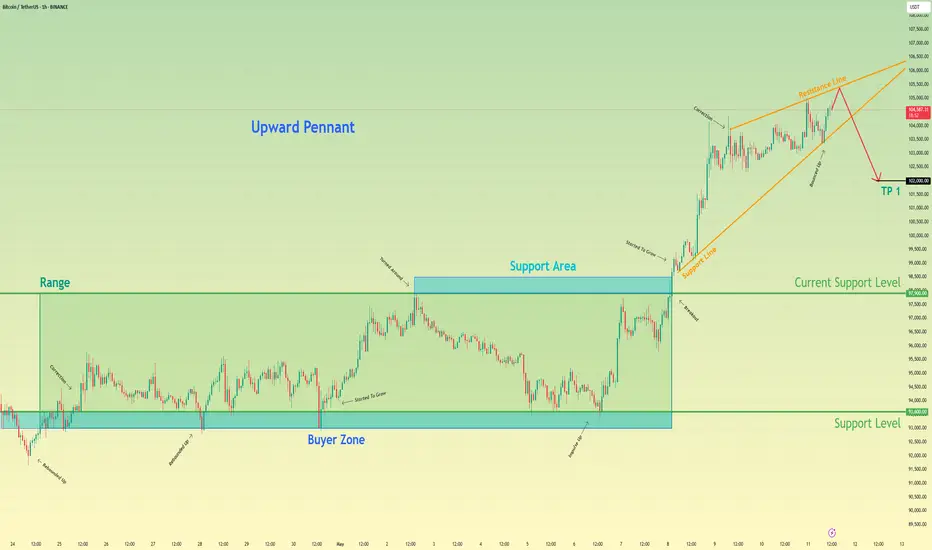
Bitcoin may drop to 102K points, exiting from pennantHello traders, I want share with you my opinion about Bitcoin. After breaking out of a multi-day range and launching a strong impulse from the buyer zone, the price has formed a clear upward pennant pattern. This technical formation often signals a potential slowdown in the bullish momentum, especially when it follows an aggressive move to the upside. The current price action shows that BTC has approached the resistance line of the pennant, but failed to generate further breakout strength. Each new impulse within the structure has weakened, and the market is starting to compress inside narrowing boundaries. The support area has been holding the structure temporarily, but the inability to push through the top of the pennant suggests growing exhaustion among buyers. This setup indicates that BTC may soon break downward from the pennant. So, I expect that it will make a correction that could drive the price down to the 102000 points, thereby exiting from pennant pattern. Please share this idea with your friends and click Boost 🚀
Sugar Is In A Higher Degree Correction; Elliott Wave AnalysisSugar has been trading lower since 2023 when we spotted final wave V of an impulse on the weekly chart. So from Elliott wave perspective, it’s trading in a multi-year higher degree ABC corrective decline, where wave C can drop the price even down to 78,6% Fibonnaci retracement and 14-12 support area before bulls show up again.
The reason why Sugar can go lower is a short-term daily Elliott wave structure, where we see a five-wave leading diagonal formation into wave A, followed by a bearish abcde triangle pattern in wave B. It can now extend the decline within wave C towards 14 -12 area which can be made by a lower-degree five-wave bearish cycle, just be aware of short-term pullbacks.
