BTC: Tired bulls against raging bearsThe 30K psychological range was strong, since price orbited for days around it, as you've seen. But Bitcoin's price has recently started to decline, primarily due to the impact of the violet line on the ascending price candles. This impact can be seen as a signal to the bulls that they have hit a resistance level and should exercise caution. While it is not always the case, many times when the violet line touches the price, it triggers a reversal.
In my previous post, I estimated this "impact" to occur around 31,200. However, it actually happened at a lower price two hours ago, as indicated on the chart. Based on current conditions, I don't anticipate the price reaching or surpassing 31,500 in the near future. Consequently, I am currently adopting a short position in my approach, but I am waiting for the price to fall below the WHITE "stairs" line twice to confirm this short scenario.
There was a fakeout crossing of the red and blue lines, which should have occurred but didn't. This indicates that the bears have enough strength locally, particularly within the 1-hour period.
My short-term forecast remains the same as in my previous post: the price is likely to drop to 29,500 and linger there momentarily before further descending to the range of 28,000-28,500. Around the 28,000 mark, we will need to conduct another analysis to determine if the price is inclined to go as low as 25,000 or even lower, or if it will rebound instead.
Please do not rely solely on my words. Conduct your own thorough analysis, re-analyze the data, and make your own decisions. Trading is a challenging endeavor that requires careful consideration.
Atémak
Correction

NZD-CHF Long From Support! Buy!
Hello,Traders!
NZD-CHF fell down sharply
And the pair seem to be
Locally oversold so as the
Price is about to hit the
Horizontal support level
Of 0.5436 I think we will
See a nice bullish correction
Buy!
Like, comment and subscribe to help us grow!
Check out other forecasts below too!

COCOA setting up for a correctionThe market rallied for a while. I expect the correction is just a matter of time.
My target around 3050, with expiry date for contract 10th August.
This is not a trading advice. Trading is risky, always to your own analysis.

BTCUSD up 31.2K then downIn this analysis, I've identified a significant moving average (MA) crossover, indicated by the red and blue lines crossing. Historically, such crossovers often lead to price increases. Additionally, I've included a violet line which I believe acts as a catalyst for a downward movement.
Once the violet line touches a candle, I anticipate the end of the upward move and the beginning of a substantial price decline. I hadn't previously considered this scenario as I was focused on other indicators and patterns.
Based on my analysis, I foresee the following scenario over the comind days:
Initially, the price will rise following the crossover of the red and blue lines.
The price will continue to climb until the violet line interacts with a candle.
Subsequently, a significant price drop is expected, targeting approximately 29500 initially, followed by around 28500.
After reaching around 28K, there will be some uncertainty, necessitating a new analysis as the price may potentially drop back to 25K.
Although I maintain a bullish stance, I believe a correction is imminent, as mentioned in my previous post. Currently, there appears to be a buying opportunity until the take profit (TP) level of 31200.
it's not finished yet for the bulls on a high perspective. I don't think we will see an enormous price drop (below 25K), since we are still in a bullish phase anyway, which needs a correction.
Remember, trading can be challenging, so conduct your own analysis and do not solely rely on my words.
Stay cautious and take care.
Atémak

Bitcoin's Psychological 30K: Uncertainty and PotentialBitcoin has reached the psychological barrier of 30K, likely triggering a temporary pullback to around 28K.
At 28K, uncertainty arises: a strong climb to 32K is expected if bullish momentum persists, while falling below 28K could test the 25,800 support level. On the Weekly, the scenario is still bullish though, but starts to weak a bit.
PS: I'm happy to see that the price didn't fall under the 25K support, and climbed as stated in my previous posts. But for now, I would say there is a little slowdown in the bull movement. I hope it is just local and temporary. We need extra candles to be more sure of the bullish strength, if it will last or not (even if there was the sudden surge which reached 30K). My bullish goal is 49K, but it's really far from now.

SPY Will Keep Growing! Buy!
Hello,Traders!
SPY is making a local
Bearish correction after
Breaking the key level
Of 432$ while trading in
An uptrend so I am bullish
Biased and I think that
The stock will go up
Buy!
Like, comment and subscribe to help us grow!
Check out other forecasts below too!

USDJPY Is Approaching Strong ResistanceUSDJPY made a sharp reversal in 2022 on a daily chart, and touched 126-130 area after BoJ policy YCC adjustment back in December. However that drop appears completed as we have seen a strong bullish reversal in the lat few months, but it's just another corrective recovery that can be now slowly approaching the end. It's ideally an A-B-C move up to 142 resistance area where we can expect a bearish turn still this year. Alternatively, this can even be W-X-Y from 127 lows, but still a corrective and temporary higher degree pause for wave B/II. A drop and turn back below 137 can be the first evidence of a top in place.

SPX on Weekly Resistance Trendline: Is It Correction Time?The S&P 500 index ( SP:SPX ) currently faces a pivotal juncture as it encounters a resistance trendline near the $4400 level. This price region assumes significant importance and necessitates close monitoring to assess potential market dynamics. Should SPX successfully breach and sustain a close above the $4400 resistance this week, it could portend the initiation of a bullish phase, with a notable target at the subsequent resistance level of $4550. This scenario suggests the possibility of further upward momentum for the index.
Conversely, a failure to overcome the resistance barrier at $4400 may indicate the likelihood of a corrective phase or the continuation of the prevailing range-bound trading conditions. In such circumstances, it is prudent to exercise caution and consider the potential downside risks.
It is worth noting that SPX recently exited the bear market territory, achieving the significant milestone of a close above $4190. This level represents a noteworthy 20% increment from the index's lowest point in October 2022. This development signals a discernible shift in market sentiment and serves as a reference point to assess the underlying strength of SPX.
To make well-informed trading decisions, it is imperative to closely monitor the price action of SPX, particularly its ability to surmount the resistance trendline at $4400. Analyzing the index's response at this critical level will offer valuable insights into its near-term direction and potential opportunities.
What do you think will happen next? Leave your comments below.
Disclaimer: This trading idea is for informational purposes only and not financial advice. Conduct independent analysis and exercise due diligence before making trading decisions. Trading involves risk, and past performance is not indicative of future results.

AUDNZD Is Finishing A Corrective RallyAUDNZD pair made an impulsive sell-off at the end of 2022 on a daily chart, which we see it as a wave (A). Since then, we can see it trading in a larger A-B-C corrective rally within wave (B) that can be now approaching important February highs resistance, from where we should be aware of another sell-off for a higher degree wave (C).
Basic Elliott wave pattern with an impulsive five-wave 1-2-3-4-5 decline, followed by a three-wave A-B-C correction indicates for more weakness.

Awaiting EURUSDEURUSD continues to hold below the important resistance at 1.0940.
We are watching for a continuation of the uptrend and heading towards 1.1080.
Before that, it is possible to see the correction develop and reach 1.0865.
A pullback from these levels would provide a good ratio and entry reason.
There is a speech by Powell today!
An important support level is 1.0800!

GBPAUD- from Weekly to H1📹Hello TradingView Family / Fellow Traders. This is Richard, also known as theSignalyst.
📈 Here is a detailed update top-down analysis for GBPAUD.
Which scenario do you think is more likely to happen? and Why?
📚 Always follow your trading plan regarding entry, risk management, and trade management.
Good Luck!.
All Strategies Are Good; If Managed Properly!
~Rich

DXY will fall moreIn previous days US dollar index made a serious down trend towards 102 level ..the bearish scenario is still valid until it move above 38.2% FIbo level..so we could see a small correction then a huge sell as an impulse.

✅AUD_CAD BEARISH BIAS|SHORT🔥
✅A Retest of the strong resistance level of 0.912 by AUD_CAD
Has happened after trading in a local uptrend from some time
Which makes a bearish pullback a likely scenario
With the target being a local support below at 0.904
SHORT🔥
✅Like and subscribe to never miss a new idea!✅

✅DXY BUYING OPPORTUNITY|LONG🚀
✅DXY is already making
A bullish rebound after the
Index fell down sharply
And hit the horizontal
Support of 102.06
So I think we will see
A further bullish correction
LONG🚀
✅Like and subscribe to never miss a new idea!✅

GBPUSD BUY SETUP 15/6REASON EXPLAINED:
if we look at current trend, its still bullish
now, price look for retracement, we choose fresh demand zone
and same level with ssr level
its better for waiting confirmation.
dyor

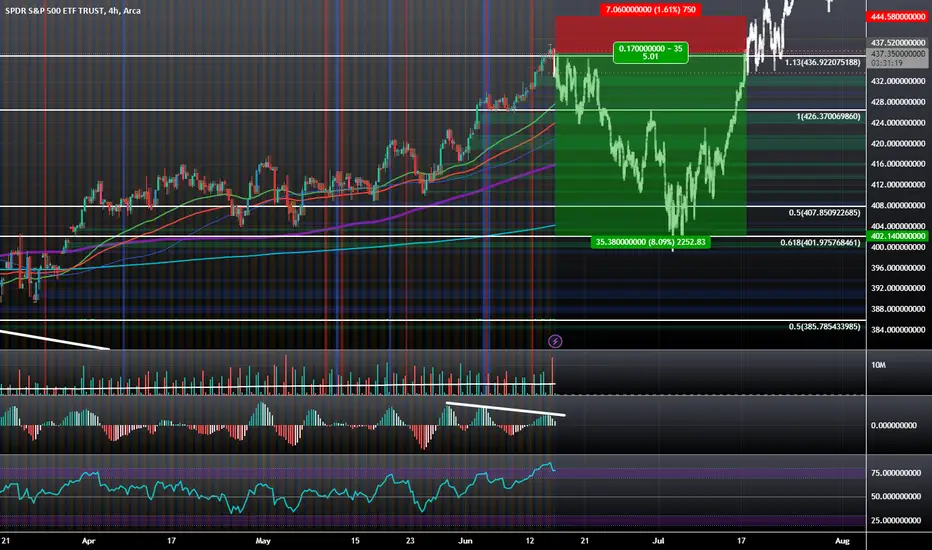
$SPY: 50%-61.8% Retrace Seems Likely Before Continuation HigherThe SPY seems likely to pull back to the levels of $420 to $400 before it can later decide whether it wants to continue the overall Bullish Trend to all-time highs. In the meantime, we are dealing with Double Bearish Divergence on the MACD, Overbought Conditions on the RSI, and a Bearish Engulfing Candle on the 4 Hour all while trading at the 1.13 Retrace of the local range it just broke out of.
EURCHF - Looking To Buy Pullbacks In The Short TermH1 - Bullish trend pattern.
Higher highs.
Currently it looks like a correction is happening.
Until the two strong support zones hold my short term view remains bullish here.

EURUSD before CPIThe first important news of the week coming up today.
We continue to look at the H1 trend reversal and buying opportunities.
On confirmation after the news and a good ratio, we will look for an entry with an initial target of 1.0940.
It is still possible to see stop hunting below the previous low of 1.0730.

Watch Solana rejection movements Big drop just happened we should see a nice big correction… I could be wrong if we meet less than 20$ then bear will dominate but I can see bulls will dominate from $12-13$ area up to 40$ maybe more if not then 30$.
As the big green canoe from 5min -30min showed green candle break out ; the bulls should be able to exit out of bear divergence.
The highest I can see is 80-85$ is a possibility so the bears can dominate more and meet the bottom.
Watch any reversals and rejection it can happen anytime.
Trade safe y’all.
Solana bottom: 5$
New solana bullrun: 5$ -500$ ( or 1000$).

EURUSD trend reversalYesterday EURUSD broke the previous highs of 1.0740 and 1.0780.
Thus confirming a trend reversal as we now have higher lows and higher highs.
This means we are starting to look at buys with a target of 1.0940 and 1.1080.
Entry grounds will be available after correction.
Lots of big news coming up next week!

Beware Of Tesla Tidal Wave Tesla has been rising high and is about to go even higher Friday 6/9 after GM announces use of Tesla charging stations. Beware this tidal wave will crash eventually but it will be a more subtle correction. We should expect Tesla to drop 2-10% in a single or multi day correction next week. After this correction Tesla should remain stable and continue its steady growth pattern. For short term traders Friday would be a good day to cash out for those who are only riding the wave and not in it for the long run. As a real estate investor who raises funds in the stock market with Tesla being 1 of 10 stocks in my Real Estate portfolio, I plan to increase my Tesla position Wednesday next week. With a currently very small position that is up 20%, I am looking to 5x my position Wednesday. So when you hear me talk about selling the position, that is strictly for those looking for a quick guaranteed profit. As a bullish Tesla investor I look forward to future explosive growth. This is strictly an opinion excerpt written by Anthony Ruggiero ( Myantman101)

NZDUSD Short Term Buy IdeaH4 - Price is bouncing higher from a key support zone.
Bullish divergence.
Higher highs.
H1 - Currently it looks like a correction is happening.
Until the key support zone holds my short term view remains bullish here and a valid breakout above the downtrend line would be the validation for this bullish view.

CHZ Bearish channel and diamondThe truth is that the global situation is wearing out and in addition to this, the fomo of the World Cup is over. I think that for my part I expect a bearish movement in this Token and thus respect the bearish channel that it has and also this possible diamond that is at the top of the channel, I would think that it is a good risk-reward to take advantage of.
