Warning ! Possibility of inverted flat and major decline !NVDA has started a rally from the latest low and brought hope for bulls.
This rally resembles 5 legs impulsive waves and MAY be a very strong Bull Trap !
Inverted flat corrections are one of the most complicated patterns in bear market. Two pictures inserted in the chart are captured from a very useful book written by Frost and Prechter titled : "Elliott wave principle key to market behavior " chapter 1, figures 1.35, 1.36, 1.37,1.40 and 1.41. Figure 1.37 shows a real example of this tempting wave pattern and major decline after completion of pattern in Dow Jones Industrial Average from Aug to Nov 1973.
The key to recognize this pattern is to recognize internal pattern of previous waves. I showed internal wave patterns of previous waves for NVDA and as you see it is very similar to text book examples.
I showed two strong resistance zones which can resist against NVDA rally and push it back down to a new low if this analysis becomes true.
These resistance zones are related to different inverted flat correction patterns : Irregular and Running . Although there are some clues for recognizing which pattern is developing before the fact by means of Fibonnaci ratios, I prefer to be conservative and take both of them into consideration for now.
Please note, we are in the world of possibilities not certainties and the scenario I suggested here is a real possibility . I do not claim that this scenario surely happens but I can confidently warn traders and investor to keep this pattern in their mind .
Good luck everybody.
Correction

ANKR Buy time #Big bull coinHello traders!
Welcome back to another episode with Analyst Aadil1000x.
After great success in CHRusdt and WOOusdt we are now buying ANKRusdt for a big bull run.
Previously I gave 100% surety for CHR and WOO but this time the surety level is a little less than 100%. Let's see what will happen in this trade as the strong bullish pattern is completed and it is ready to fly and we are ready to move with it.
ANKRusdt buy now, its a 0.03036
Stoploss 0.02810(-7.4%)
Target 1, 0.03432(+13.1%)
Final Target 0.03876(+27.7%)
Don't forget to hit the like button and follow to stay connected.

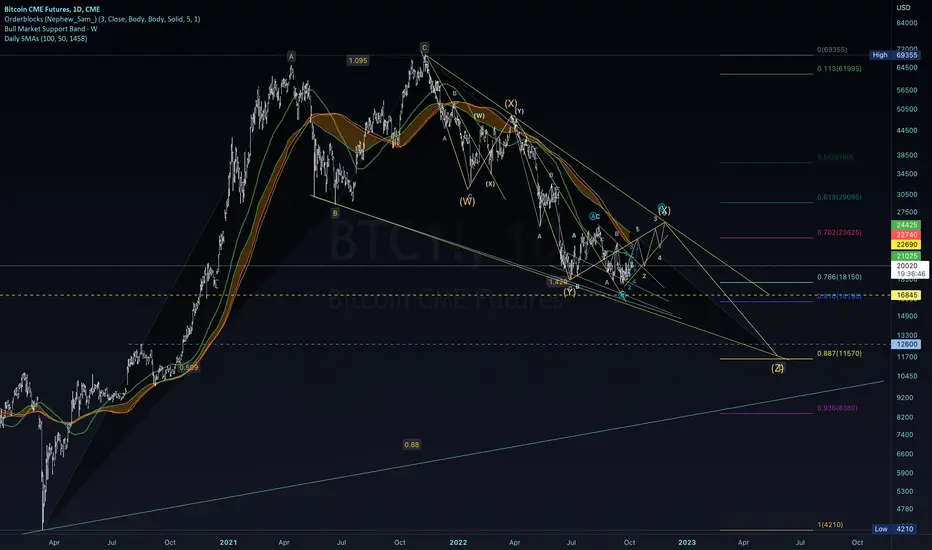
CME chart for WXYXZ correction WXYXZ correction with flat X rising wedge rally, revisiting prior idea below with C up in progress

XAUUSD LONG TRADE hello traders
In today's session, buy gold, the target is level 1727
Analysis
We have a strong support level
And a bullish impulse wave and an expanding correction pattern, we are expected to get another bullish wave

EURUSD H1 analysis Like we said yesterday, the downtrend on EURUSD is still valid and the best trading opportunities will appear as soon as price confirms another downside push.
However, it is still early to enter short and expect to see a breakout of the previous low.
We are now waiting for the pullback to continue and trick us a few more times.
That's why we should reduce the amount of trades and position size before we see a clear setup.
We could potentially see a drop to around 0,9750 and then another push higher maybe taking price above the parity level.

CHF JPY LONG TRADE Hello traders
in today's session buy chf / jpy
Analysis
There is a break in the structure and the price responded to the block of orders and we have an impulse wave and now the price is correcting and we will get another impulse wave

BTC OPEN TRIANGLE IDEASame concept for a ABC B wave rally, but with an open triangle/ expanding wedge connector culminating in an impulse to the 886 area..


XAUUSD LONG TRADE wave analysis
impulse wave
correction
running flat
support and resistance
liquidity
break out
pullback

Possible UPside of the AUD/USDhello traders
we have a break in the structure and an increase in the buyers’ momentum, and the price is declining in a corrective manner. It is possible that we will get another Bullish wave to grab liquidity Before the drop.

Wave Analysis Summaryhello traders
Some traders don't understand my analysis so I prepared this as a summary of what I learned in wave analysis

The 200-week ma on SPX 500 really is working beautifullyDisclaimer:
The information posted on Trading View is for informative purposes and is not intended to constitute advice in any form, including but not limited to investment, accounting, tax, legal or regulatory advice. The information therefore has no regard to the specific investment objectives, financial situation or particular needs of any specific recipient. Opinions expressed are our current opinions as of the date appearing on Trading View only. All illustrations, forecasts or hypothetical data are for illustrative purposes only. The Society of Technical Analysts Ltd does not make representation that the information provided is appropriate for use in all jurisdictions or by all Investors or other potential Investors. Parties are therefore responsible for compliance with applicable local laws and regulations. The Society of Technical Analysts will not be held liable for any loss or damage resulting directly or indirectly from the use of any information on this site.

UPDATE to BTC BULLISH RALLY IDEA with bearish C in progressThis is an update to the following charts still in play, and playing out actually,
IF we see a strong rejection at 618 retrace of our last impulse down from 22850 to 18150, which is at the 21k area, coincidentally at the 100 daily simple moving average, I'd be looking to this count. We have had two confirmed drives of daily bull divergence on the RSI, and MACD crossing over bullishly on the daily. Stochastic RSI however is at its highs, and so how quickly it comes back down versus price is a key thing to watch for.
Overall concept considers the possibility of an ending diagonal C wave as discussed in the ideas linked above...

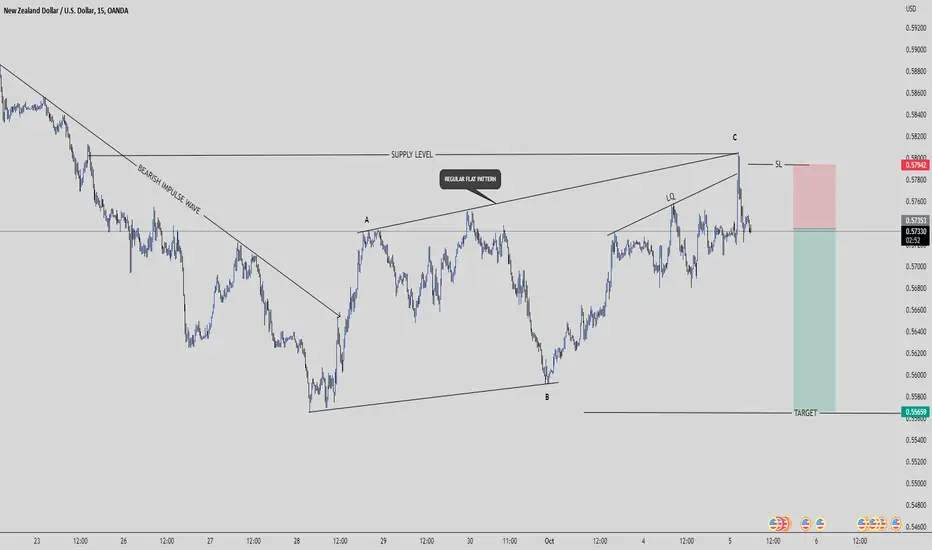
Potential Downside to NZDUSDHello Traders
In today's session I sell nzd / usd
Analysis
We have a bearish Impulse wave and we have a correction in the form of a Regular flat pattern and the price has reached the supply levels. There is a violent reaction from the sellers. We are now expected to get a bearish impulse wave that will break the bottom
B wave alternative from 18600-700 to 22K areaThis a bearish B wave alternative, but a bullish short term rally nonetheless..

CAD JPY SHORT TRADE Wave analysis
market structure
price action
order blocks
liquidity
impulse wave
correction
expanded flat

Wait for rejection on EURUSDAfter a very definite downtrend, it's now time for a pullback on EURUSD.
Right now, we don't have any signals to sell yet.
Today, we need to observe and see how it will react between the levels of 0,9850-0,9930.
In moments like this, it is very important to show patience and wait for the right signal to enter a trade.
The downtrend continuation will be confirmed on a breakout of the previous low!

NVDA daily RSI divergence at the end of wave 5 downtrendNVDA daily RSI divergence at the end of wave 5 downtrend. Expect ABC correction or change of trend )))

Intraday Update For SP500 Futures- Although the European stock markets closed with a positive sign on Friday, investors were taking a step back to evaluate the data on inflation in Europe and the US, since they are afraid of a global slowdown in growth and an aggressive tightening of the monetary policy by Central Banks.
The new record from 9.1% inflation in August to 10% inflation in September as the European Statistical data showed is provoking worries for the continuation of the ECB to raise again the interest rate by 75 bp. 10 countries out of the 27 in the Eurozone announced double-digit inflation rates. Dax40 closed for the third consecutive week in a negative sign at -1.38%.
On the other side of the Atlantic, things in the US region are pretty much the same, since personal consumption expenditures – the FED’s ideal measure of inflation – rose 0.3 percent in August from July. Specifically, consumer spending after the drop of 0.2% in July rose 0.4% in August. Consumer expectations for average inflation over the next five years fell slightly from 2.8% to 2.7%. Consumers’ expectations for inflation next year fell to a one-year low of 4.7%, down from 4.8% the previous month.
All those readings force the US officials to tighten the monetary policy for some time to be sure that inflation returns to target. Dow lost 2.9%, the S&P 500 2.9%, and the Nasdaq 2.7% weekly. On a monthly basis, the industrials index fell 8.8%, the broader market index fell 9.3% and the technology index posted double-digit losses at 10.5%.
Looking at the SP500 futures, the market came down perfectly after that rally up in four into 3750 resistance, before price came down from a triangle in red wave (4). Thus, current stabilization is normal and should unfold in 3 legs. Ideally thats now a higher degree wave four with resistance at 3750.
#Elliottwave #spx #spy #ES_F

Is it time to sell EURUSD?EURUSD rejected the sell zone on Friday.
Now, we could see the beginning of the next downside move.
You can wait for a confirmation which will be a breakout of 0,9731.
However, selling right now is not yet confirmed as we can easily see price going above 0,9854.
The direction is still to the downside and we are only looking to sell!

NASDAQ RSI DIVERGENCE, FIBONNACI!!Nasdaq has reached its crucial support. information is spreading about a recession in us markets, but technical like supports, rsi are saying to rise.
although inflation is too high in us, and the markets too have corrected about 35% from its top, it do looks like, markets will not correct further more.
same saying in the fibonnaci indicator. the index is lying in 0.618 zone.
lets see if the stock do gives a gap down, and gives a breakdown, or rise.
although last one statement, that NIFTY IT too have reached its last support and should not fall further(still it is been rising very slowly this days, but its in the same zone, unless us markets will stop falling). therefore i dont think much like there would be a further correction. ofcourse i could go wrong but lets further watch how markets do perform.

DJIA, A comprehensive analysis from 1932 to 2022 ! Whats next?Hi great followers, traders and investors !
Today, We analyzed one of the most important indices in US market. I decided to record a video since I thought that it may be difficult to show what I am thinking in writing. In fact, I wish to transfer my idea better by this video.
In this video, We investigate Worst, Moderate and Best case Scenarios. We analyzed the index from 1932 to 202022 and discussed different possible scenarios. We can never predict the future without looking to the past.
As I told in video, what I currently suppose to be the most likely scenario is the moderate one, but we have to keep in mind that other scenarios even bullish one is possible therefor, we have to be open-minded and be ready for all possibilities.
Good Luck every body.
