BITCOIN & SP500 | THE SIMILARITY IS PRECEDENTED | NOT A HEDGE.No unnecessary words needed. The chart speaks volumes.
Bitcoin has never experienced a recession let alone a pandemic.
Bitcoin will follow and mimic the global economy so long as economic implications exist.
Main indicator for investing in Bitcoin should be the SP500, or any other equity index.
This isn't a bull market. This is a bull trap correction.
VERDICT: Bitcoin is not a hedge and will follow the broader markets until this recession/pandemic is over. Just ask yourself... why would bitcoin act differently?
Correlation

BTC has one last price crash before price stabilizationIt's no surprise that BTC trails SPX performance. If the SPX takes a beating, BTC takes a beating. There has been a historical correlation between the two for some time now. That begs the question: are we ever going to see a divergence between BTC and SPX, and if so, why would it happen?
Taking a look at my chart, I performed a regression analysis on BTC prices from late 2017. Current regression analysis shows a current trend price of 9111, with SD of +1 and -1 encapsulating most historical price movements. At current, BTC is well below the 9111 trend price. The reason is as stated above - it is treated as an asset correlated with S&P prices. Running a regression on BTC prices against the SPX gives me an r value of .43, which indicates a fairly strong correlation. This means most BTC retail investors do not view BTC as a hedge against the market, but rather as a further indicator of the market; they view BTC prices as relative to the strength of the equities market. This view couldn't be further from the truth - BTC should gain value if every other market declines since it's meant to represent a free-standing 'currency.'
With that in mind, for those who think that the equities markets have yet to bottom-out, BTC also has yet to bottom-out. I do not believe that equities will remain at current valuations. Prices will continue their descent, and as retail investors cash out of equities, they will cash out of BTC, presenting BTC traders with a prime opportunity of entry. I believe it'll go as low as 4800 before it begins trending back up 9000 and beyond.
To further evidence the weakness in the current bull trend, I've shown the RSI and DMI as well as 30 vs 13 MDA. RSI is hovering around centre while ADX in DMI shows weak momentum. BTC investors are clueless about the strength of the current market. If the market was strong, they'd have no problem keeping their position. If the market is weak, they want to believe it's strong so they end up unsure - clueless. SPX is set for another price crash, and so is BTC. I'd market a good BTC entry point at 5000.

BTC | S&P 500 - Slightly pumped on initial jobless claimsRed line is futures on S&P 500.
CC indicator below is correlation between XBTUSD and S&P 500 on 15m time frame.
Initial jobless claims was released, and rose 4.43 million last week, total is more than 26 million since the coronavirus outbreak started.
S&P 500 slightly pumped as expected (as in previous times) and trying to rose higher, as well as bitcoin.
Won't be long here ('coz we're at resistance), awaiting $7250-7300 for shorts.
Hit the "LIKE" button and follow to support, thank you.
Information is just for educational purposes, never financial advice. Always do your own research.

DXY short - Supply Demand - h4, h1Hello Traders!
On DXY I could determine a Trend Line and Support Resistance. Currently DXY is dropping. I expect it drop at least to the h1 Demand Zone. Which is the blue Zone on the chart.
What can we expect:
If we are at the Demand Zone we can expect the price to go up. Then we will have the opportunity to short at the Supply Zone.
That was my Idea and I hope you liked it. Please leave a LIKE if you like the content. In the comment section you can share your view and ask questions.
Thank you and we will see next time
- Darius.

how i trade dax and get 50 point first thing in the morning i dont know how long this is going to hold
but for these days i depend on nikke 225 and AUD/JPY daily chart move to find out the daily general direction for dax
I will try to make it clear
so basically there is time delay between nikke 225 and dax 30
so when then Frankfort market ring the bell nikke 225 and aud/jpy has already been traded for 7 and 9 hour i depend on these two if they are up i go up for dax
if they go down so we will visit south , usually i take small target on this rule 50 point its working very well for me most of time finish in less than 2 hour
i also check euro performance against pound and usd dollar as euro suffer i take it as a sign to confirm dax ealry move shape .
i also fell more comfortable when i see NZD doing well against CHF , I ALSO CHECK TA125 AND IMOEX early news for good omen no more - u never know when conflict rise in middle east
so basically it demonstrated for me i advise not to use it when market start with gap unless u know what gap realy made for then u can go for it .
i like to trade correlation in general , cause even when this fail me there is Chance for dax to go 50 point in your favor before he went in the other direction against you
i use it long and short every day for less than month \ when i fell that sign are weak i dont trade with it or just go for small lot and trailing stop with 750 point space some times if i feel that its my day and my general chart for the week stick with my daily vision i go for trailing stop after my first 50 point , i like to look for them as a home work

Is Bitcoin going to follow Nokia's chart pattern?While evaluating Nokia stock I couldn't help but notice that Bitcoin could be following what Nokia's chart pattern did? What do you guys think leave comments below!

Bitcoin and sp500 are brother for life.It's sad, but you have to see the truth in the face, the two are correlated from the beginning, they always act in the same direction. Bitcoin has never been independent until now from the stock market.

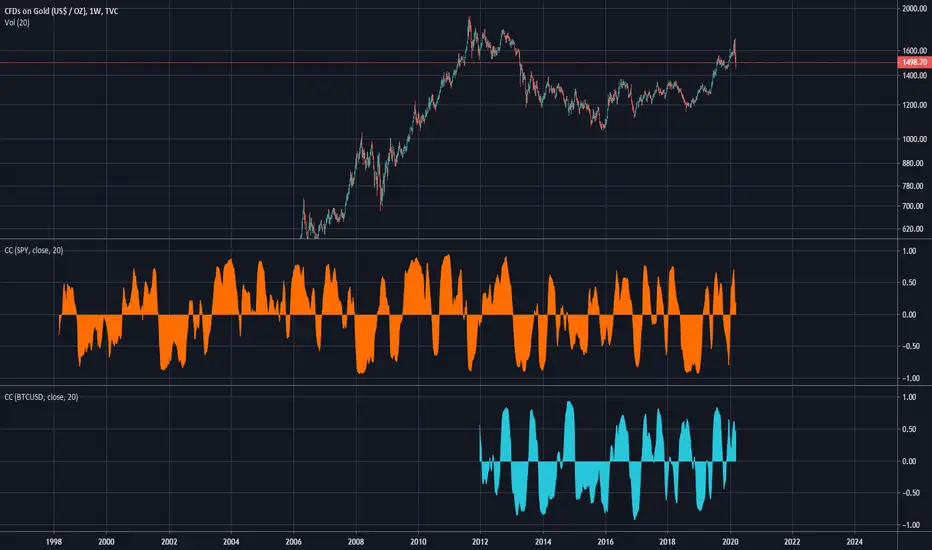
S&P, Gold & BTC Correlation - when safe haven?For the last 6 weeks or so, there's only been one thing to trade - The Market, as everything moved up and down together, gapping violently based on news.
These daily charts show how the stock market (SPX/S&P 500) has correlated with the historical safe haven asset of gold (XAUUSD) and the promised new safe haven of Bitcoin (BTCUSDT). The red indicator at the bottom is the standard TradingView Correlation Coefficient (CC).
In the first chart, BTC - in blue - largely moved with the S&P, showing a high CC throughout the crash. Notably, it had a more extreme flash crash (crypto loves extremes), and also recovered off the bottom more quickly. These differences aside, BTC remains highly correlated with the stock market for now.
In the second chart, gold - in yellow - at first continued its rise as stocks fell, but then had a sharp selloff of its own. It's been reported that this was probably due to traders being forced to sell positions in order to avoid margin calls as equities got smashed, and that sounds reasonable to me. Since that started, gold has been very highly correlated with stocks, falling and recovering together.
In the third chart, perhaps somewhat redundantly, we can see that since March 9 or so, gold and BTC have become and stayed well correlated.
Where next?
Notably, gold has now exceeded its pre-crash high, while stocks are still down 16%. Gold is also trading well above all of its daily moving averages, while the S&P is still underneath the 89 and 200. This is at least some technical reason to think that their trajectories might be different soon.
My bias, based on fundamentals, is short equities and long precious metals and crypto. But I can't trade that until their correlation drops – until the further drop in the stock market that I think is coming panics gold investors not into selling, but buying. So I'll be watching this chart carefully.
+Obligatory "I'm not an expert, this isn't advice". Stay safe out there!

Equities to dip soon? BTC and /ES still very correlated.Last Monday, /ES blew past 2550, the "trendline-in-the-sand", making an imminent retest of 2200 fairly unlikely.
However, a trend channel is being developed with multiple signs of rejection at the top of the channel, most recently from 2800 on Thursday.
Also note that the correlation of Bitcoin and equities has been extremely high since the start of this crisis. This supports the theory that Bitcoin is treated like a risk asset by the markets. For now, if the correlation holds, it could mean that equities will reach the lower part of our channel fairly soon. A rough price target is given as 2585, or a little over 7% decline from current prices.
Disclaimer: I am not long or short this market as I do not generally trade on such short time frames. I am in a neutral position for now and am planning to get long when my target is reached.

Bullish bat confirmed by a bullish engulfingHi pros!
chart talk by itself, on the other side we shorted oil. that could be interesting to enjoy both trades based on negative correlation and high probability setup (harmonic)

Latest traditional market (SPX) normalised Bitcoin (XBT) Charton the 6 hrly timeframe with CYBER ENSEMBLE {Premium} buy/sell indicator.
Continued from:

Bitcoin/Gold Ratio - Is BTC topped out in terms of Gold?Interestingly enough, the long term chart of Bitcoin/Gold - AKA how many gold oz 1 bitcoin buys you, seems to be following the issuance curve of bitcoin supply...which is going to have less and less deflation going forward, due to the principle of Bitcoin. Doesn't mean anything for the U.S dollar price of bitcoin really, just implies that gold will out perform Bitcoin in a hyper inflationary environment, contrary to what many BTC bulls believe.
What do you guys think? I am open to all ideas. This could be wrong!

Why 7500-8000 is Important for BTC & Why You Should Look at SPYHello Traders, today we look at Short and Medium-term analysis of BTC Daily chart.
Short-term:
Contrary to it's designed purpose to act like a safe haven during crysis, BTC is currently moving along with major markets. My take on this is that compared to the Stock markets, Crypto is still very young and small and more than anything fueled by fear and greed.
For the actual range, we will, therefore, need to see which direction SPY takes. BUT! this correlation can slowly fade away as traders adjust to the current situation and start thinking more rationally again.
Medium-term:
At roughly 7500 we have many converging resistance levels which, if broken, will act as new support. If the price establishes at around 7500-8000, this will be a good sign for the bulls. Note that this can take a few weeks, again based on that happens in markets in general.
Watch for manipulations and wait for extra confirmation by daily bar closing prices.
Be safe and trade well,
FINEIGHT team

Bitcoin vs S&P500 vs TASI - Correlation Coefficient Bitcoin <> Dow/S&P500 correlation is back to zero for today, it is not yet inversely correlated or confirmed to be uncorrelated either.
That would depend on its behavior in the next few months and at different sets of market conditions.

XAUUSD PLAYING A RANGE IN A SELL ZONE. As you can see in my previously XAUUSD analysis posted, Gold still playing a range in a Strong Supply Zone.
I'm expect a reversal soon, just wait for a reversal closed candle to consider a Short Position.
As a strong confirmation, we can see his correlation XAGUSD, reached his supply zone in the same timing of XAUUSD without broke it.
Demand Zones to consider as a Target as you can see are indicated in the graphic.
*Place a stop loss little bit more high than the currently resistance/support formed to don't take fake stop loss (set your stop loss at a level where it invalidates your trading setup).
Tap a LIKE if you think is a useful idea and comment below if you would share also your idea!
Please do your own research, and follow your trading plan with a properly Money Management.

AMPL / BTC CorrelationSimple Correlation Coefficient time series between AMPL/USD and BTC/USD on Bitfinex.

SPX Correlations Broken Down vs 10y yield, Oil and GoldThought it would be interesting to visualize the recent breakdown of correlation coefficients between the equity markets (SPX) vs fixed income (US10y yield) and commodities using a weekly chart and plotting the correlation coefficients vs the following: WTI oil (growth indicator) and gold (safe haven). A correlation coefficient of +1 indicates assets moving very strongly together and -1 indicates assets moving inversely (in opposite directions) to one another:
1) SPX vs 10y yield: bonds initially bid in flight-to-quality and then sold off along with other safe-haven fixed income
2) SPX vs gold: same thing, initially bid up then sold off (lots of portfolio margin calls, investors scrambling for liquidity/cash etc.)
3) SPX vs oil, correlations broke down to begin 2020, but then moved up to a very strong positive relationship into the heavy market sell off.


Updated traditional market (SPX) normalised Bitcoin (XBT) ChartNow that a new somewhat trending market structure is starting to form after the recent "blackswan" triggered dump correlated to the tradition markets, here's a re-look at the SPX normalised Bitcoin chart to look out for bullish decoupling in a time where the traditional market remains bearish.
In summary, for BTC to switch into a bullish "decoupling" phase wrt to the traditional market, the ratio needs to at least break up above the Ichicloud and finds support; at least that is where I will set my buy in point (at around 2.36, and then stop-loss at below 2.09 after).
See initial look and discussions on this experimental analysis attempt:

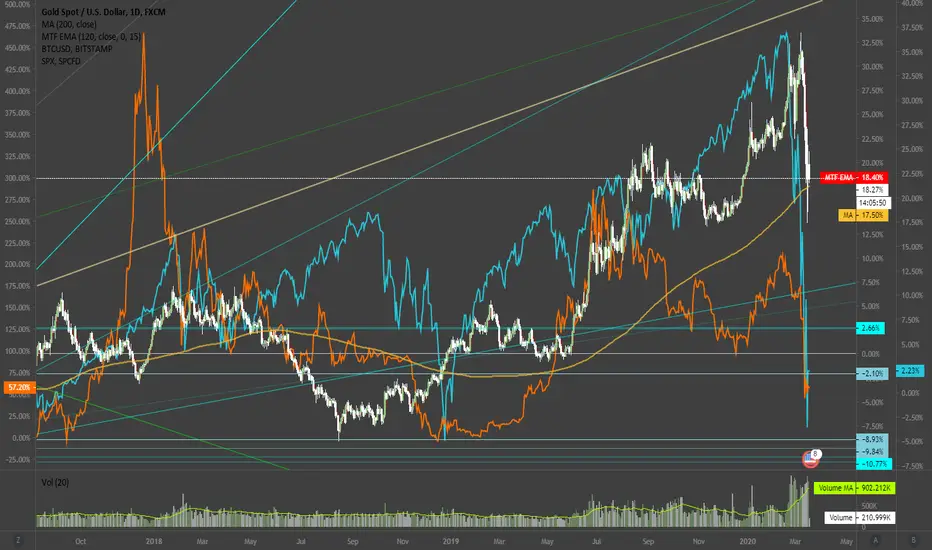
Hedge vehicles suffer Institutional Sell-offsThis chart compares XAUUSD (Gold, bar), S&P 500 (blue line) and BTCUSD (orange line).
After a well deserved correction, Bitcoin has been used as a low-correlation hedge vehicle for institutional investors, following its securitization in Chicago's trading floor. It is apparent from the given chart that both Gold, which is commonly conceived as a safe haven during bear market, and Bitcoin coincide in their tides until mid 2019.
From late 2019, however, the relationships transform. As institutional investors stock their access hedging balances into cryptocurrencies as safe havens, Bitcoin tends to increase in price along with the equity market. Upon market disruption, however, Bitcoin, which generally has relatively smaller daily trade volume compared to public equities, suffer significant value loss as institutional investors sell-off their hedging vehicle.
From being a low correlation investment instrument, with the entry of institutions, the cryptocurrencies are facing the same correlation-risk as any other instruments available.
None the less, the notable movement in the latest bear market is the correlation between Bitcoin and Gold, where neither of them seem to offer a proper hedge against the beta.
$AAPL still good for correlation trading Correlation trading strategy idea analysis.
In my previous posts, I showed a good possibility for correlating trading of $M.
Now I am going to show you $APPL again because of it still suitable for this strategy.
Apple has a huge weight in S&P500, so the correlation predetermined to be notable.
Look at the $SPY and $AAPL charts.
Actual corresponding support&resistance levels look so much alike.
Correlation is good enough to expect future similar moves.
There are a lot of freshly formed support&resistance levels.
So, we can find many opportunities to catch the strongly correlated move.
Following the correlation trading strategy, it is reasonable to wait for correlated level breaking.
When $SPY and $AAPL simultaneously break their resistance levels, It will be possible to buy $AAPL.
When $SPY and $AAPL simultaneously break their support levels, It will be possible to short $AAPL.
Do not view this idea as a recommendation for trading or investing. It is published only to introduce my own vision.
Always do your own analysis before making deals. When you use any materials, do not rely on blind trust.
You should remember that isolated deals do not give systematic profit, so trade/invest using a developed strategy.
If you like my content, you can subscribe to the news and receive my fresh ideas.
Thanks for being with me!

$M can continue correlate with $SPYCorrelation trading strategy idea analysis.
The market was very volatile all the last three weeks.
There are a lot of freshly formed support and resistance levels.
Also, there are some older levels, which were formed in 2008.
So it is a very good time for correlation trading.
I showed my vision of correlated moves in my previous ideas.
Today I am going to show you a possibility of correlation trading of $M.
Now Macy's is a very cheap stock with good enough correlation with SPY.
Look on the $SPY and $M charts.
Actual corresponding support&resistance levels look so much alike.
We can expect future similar moves.
Following the correlation trading strategy, it is reasonable to wait for correlated level breaking.
When $SPY and $M simultaneously break their resistance levels, It will be possible to buy $M.
When $SPY and $M simultaneously break their support levels, It will be possible to short $M.
Do not view this idea as a recommendation for trading or investing. It is published only to introduce my own vision.
Always do your own analysis before making deals. When you use any materials, do not rely on blind trust.
You should remember that isolated deals do not give systematic profit, so trade/invest using a developed strategy.
If you like my content, you can subscribe to the news and receive my fresh ideas.
Thanks for being with me!
