Overall view of USDJPY107.900 level was attempted to be broken downward several times. Prices are around a strong support zone which contains the hypothetical low of the year (The real low is 104.830 due to the gigantic 400 pips fall of January 2nd followed by a massive reversal to the concerned zone). The odds of an upcoming bull run are average to low. Market has been ranging for a while, in preparation of an eventual volatility.
Possible targets : @109.180 (+80pips), @110.000 (+160 pips) and @110.500 (+210 pips).
Advice : Stay bullish and buy at any low point while we don't break the support zone or 107.900 bottom level. We are close to the bottom level and markets are ranging so the risk is low.
Correlated pairs : CADCHF (92.9%), XTIUSD (89.3%) and XAUUSD (-79.7%).
We are more likely to experience a ranging market near its bottom as with the CADCHF and XTIUSD. XAUUSD is spiking, therefor this increases the odds of a retest of the bottom levels of the inversely correlated pairs.
Correlation

Overall View of EURUSD - Update of June 17th week1.13478 top level was reached after a sharp bull trend. Prices settled on a resistance zone and were subjected to a bear pressure. After a strong reversal signal on June 12th, the odds of a bear trend became higher.
Possible targets : @1.12000 (+75pips) and @1.11200 (+150 pips).
Advice : Stay bearish and sell at any high point while we don't break the resistance zone or 1.13478 top level.
Correlated pairs : USDCAD (-87.8%) and XAUUSD (62.5%).
We are more likely to experience a strong bull spike with the USDCAD while a minor effect on the XAUUSD .
Previous view: Odds of a bear continuation are high, stay bearish and sell at any high points while we don't break the resistance zone or 1.13478 top level.
Actual outcome: Prices were side ways with a test of the strong institutional level 1.12000 and forming a daily doji bar. Likewise bulls attempt to reverse the trend failed
Actual view: Prices are still subjected to a bear pressure. Odds of a bull trend continuation are high.
Possible targets : @1.12000(+20pips) and @1.11400 (+80pips).
Advice : Stay bearish and sell at any high point while we don't break the 1.12600 top level.
Correlated pairs : USDCAD (-87.8%) and XAUUSD (62.5%).
USDCAD is still on a very strong bull spike, confirming that there are more odds for the EURUSD to continue its downtrend.

Overall view of USDCHF - Update of June 17th weekPrevious view: Odds of a bull continuation are high, stay bullish and buy at any low point while we don't break the support zone or 0.98601 bottom level.
Actual outcome: Prices were side ways with a test of the strong institutional level 1.00000 and forming a daily doji bar.
Actual view: 1.00000 top level attempted to be broken after a sharp bull trend. Prices are still subjected to a bull pressure. Odds of a bull trend continuation are high.
Possible targets : @1.0100 (+100pips) and @1.0200 (+200pips).
Advice : Stay bullish and buy at any low point while we don't break the support zone or 0.99500 bottom level.
Correlated pairs : USDJPY (89.6%), XTIUSD (88.5%), EURCHF (89.2%), XAUUSD (-87.9%).
We are more likely to experience a strong bull spike with the USDJPY , EURCHF and XTIUSD pairs. In fact a bullish trend on USDCHF may announce an incoming bearish trend of XAUUSD , actually under sellers pressure.

Divergence between ETH and BTC?Are you worried?
ETHUSD
Price action pros and cons
Bull Case:
Trading with in rising channel
Holding above 200sma
Holding above 50sma
Consolidating between $155 and $188\
Lack of strong selling pressure
Bear Case:
Difficulty staying above the 20sma
Lack of strong buying pressure
Stoch and AO still have room to move on the downside
Alt coins considerable weaker than Bitcoin
Correlations:
DATE BTC-LTC BTC-ETH ETH-LTC
1/16 ... 0.73 ... 0.26 ... 0.29
4/16 ... 0.94 ... -0.06 ... -0.06
7/16 ... 0.76 ... 0.06 ... -0.08
10/16 ... 0.67 ... 0.38 ... 0.22
1/17 .... 0.65 ... -0.01 ... -0.01
4/17 ... 0.20 ... 0.27 ... 0.1
7/17 ... 0.38 ... 0.19 ... 0.08
10/17 ... 0.64 ... 0.74 ... 0.65
1/18 ... 0.26 ... 0.13 ... 0.67
4/18 ... 0.77 ... 0.76 ... 0.74
7/18 ... 0.93 ... 0.92 ... 0.90
10/18 ... 0.83 ... 0.74 ... 0.87
1/19 ... 0.90 ... 0.88 ... 0.91
4/20 ... 0.86 ... 0.90 ... 0.82
Several articles have likened the recent lagging performance of altcoins to the situation they experience in Jan 2017. The articles have basically pointed out that traders will soon be selling there BTC to buy the cheaper altcoins, such as LTC and ETH. However, I would like to point out how the crypto environment has changed over the last couple of years. Before 1/17 there was often a negative correlation between BTC and the altcoins, but since 4/18 the correlation between the coins has been greater than 0.75. As a quick reminder: altcoins that approach 1 are closely correlated with Bitcoin, altcoins around 0 are not correlated with Bitcoin, and altcoins that approach -1 are inversely correlated with Bitcoin. This measurement is known as Spearman’s rank correlation coefficient. Thus, in this current highly correlated environment we as traders would be wise to keep our eyes on the leaders to predict future price action.
Comment and Feedback Welcomed!

Short EURAUDReaching the ceiling of the pair, I expect a drop coming soon. There is a Draghi speech later today which could take it to the roof of the S/R but will drop thereafter.
If you are in agreement, please leave a like or comment.
Triforex


A stock company can predict the next path of Bitcoin? - 03A stock company can predict the next path of Bitcoin?
Chart 03


The Photography Stocks Industry - 01The Photography Stocks Industry - 01
Correlation between CG and SSTK.

Goldman Sachs - Will follow the JPM path? - 01Goldman Sachs - Will follow the JPM path?
Comparison between GS and JPM

BTC/ALT Correlation Suggesting Breakout Imminent?Note the correlation between BTC dominance and ALT total market cap over the past 45 days or so look awfully similar to the period between October and November of 2017. Could this be a signal that the alt coin market is about to breakout?

Short/medium term correlation between BTC and stock indicesSo, I was stating yesterday that one of the reasons why BTC turned unexpectedly bullish, is the strong performance of stocks, especially tech stocks.
That makes me believe that many treat BTC as a tech asset, especially CBOE and wall street players.
So, we see the correlation on shorter timeframes is definitely there, even though it is a bit delayed.
The overall structure is quite similar, and the global trend also.
First downtrend, then uptrend, and the ellipses show that the larger pumps and dumps in NASDAQ can also be found in BTC.
Many expected a strong dump this year in stocks, but instead stocks are just continuing to pump.
And the large supercycle yearly picture for stocks shows that this can go on for another 10 years until some larger correction (crash) can take place:
There is also some correlation on longer timeframes, I'll soon release a chart on that comparison.

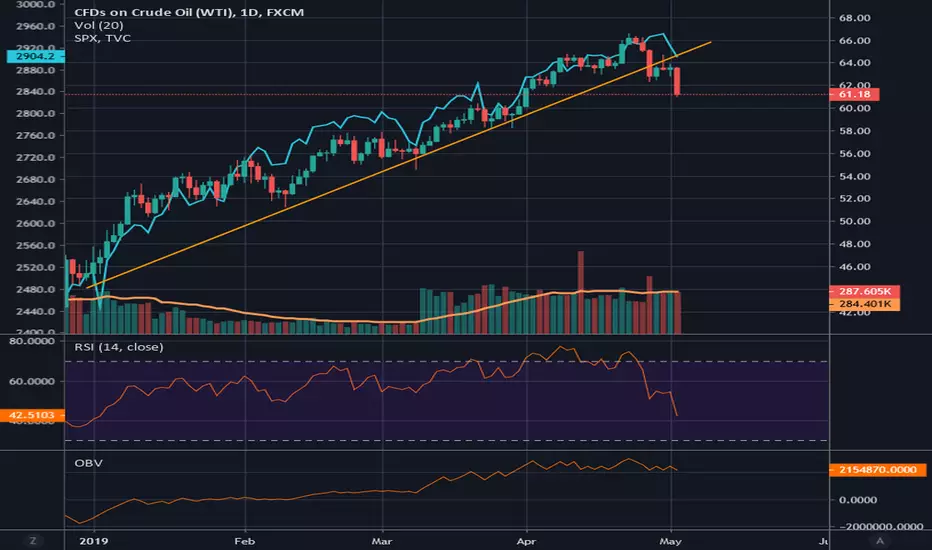
Correllation of SPX/NDX with OIL still highThis correction was predicted using the correction from OIL that started a few days before the major indexes.
Use oil as a solid indicator as to the direction of the stock market will take.

USDMXN leads USD devaluationI like to plot USDXXX and XXXUSD against DXY or Equally Weighted USD Indices like the EWI I prefer because then you can tell if the USD is devaluing faster than the other currency of the named pair, in this case MXN.
First thing I notice is the strong correlation. Even though quoted in USD a pair does not have to correlate that strong if the other currency is volatile as well.
I have added a correlation coefficient (cc) indicator below the chart. Above zero means positive correlation. You can also tell from the cc indicator that USDMXN and DXY correlate positive most of the time, also called strong positive correlation.
There is even some divergence between the two charts, as indicated by the disjointed angle drawing.
Concluding that it is expected USDMXN to drop more than DXY, which I have indicated with the darker red arrow.
General disclaimer applies....


ANALYSIS: TRADING RISK ON/RISK OFF SENTIMENT (USDJPY & DOW)In this video, we take a look at the key correlations between risk-on and a risk-off market.
Typically when we see the stock market indexes fall, the safe haven currencies see significant strength.
Looking back we can highlight opportunities when the stock indexes fall and the JPY sees significant strength.

USDCAD - OPEC Meetings, Positive Correlations & Shorts So beginning with fundamentals, this is going to be an interesting pair to watch this week with the OPEC Meetings as well as the crude oil inventories on Wednesday. The discussion on oil being the most volatile topic as the OPEC represents 40% of the worlds oil supply alongside other news events such as FOMC talk and various other data releases.
Doing bit of research on oil, I found something quite strange and intriguing. So if you are unaware of the correlation between Gold and USD, being a negative correlation i.e when the dollar strengthens, the price of Gold drops. The same goes for the commodity oil and the US dollar. HOWEVER, in recent times we saw both the DXY and Oil prices rally higher. Now this rarely occurs and if I am not mistaken, this positive correlation we saw was the 11th time in history that we've seen this.
With that in mind, I was slightly hesitant on whether or not the positive correlation and rally higher would continue, but it seems to have been a temporary correlation and 'trend' if you will, seeing prices of oil surge from $63.25 per barrel to $64.69 at the time of writing this article, as well as we've seen the dollar weaken and USDCAD tank to the downside.
I am going to come back to this but I'd like to jump into the technicals. So starting on the weekly timeframe and looking left to the beginning of 2016 where we saw a massive impulsive downside move, we can see we have been making lower high swing points in the bigger picture. These impulsive moves are accompanied by a slow & steady retracement to the upside, creating new lower highs followed by another impulsive move and we can now expect a similar move potentially. So what we are able to see is at the beginning of September 2017, we began ranging in a corrective ascending channel. Dropping down to the daily timeframe we can see multiple higher highs and higher lows being created. However, around the 7th of March we created a 3 pin pattern signalling a reversal and a new lower high created with an expected lower low to follow.
We also had the rejection of the 71% Fibonacci level in the green block annotated " 61.8/78.6 Retracement Zone " with the bottom being the 61.8 and the top being the 78.6 Fibonacci level. Putting the EMA's on, we can see the bearish crossover on the daily timeframe and lower as well as the break below the EMA's. The descending trend line is also being respected as well as the counter ascending trend line was broken, retested and price spiked to the downside. I currently have a short running from 1.33745 with +/- 65 pips profit and risk free.
We have also managed to close below the monthly key level with substantial bearish pressure and I expect further decline with CAD strength coming into play with OIL rising and the DXY (Dollar Index) set for a decline. The green rectangle is an area of support I'd like to see broken before a further continuation of price going lower.
Jumping back to the research and we can see that we've reached our yearly high and we are due for a pullback however price is still surging prior to the OPEC Meetings. I am short on USDCAD as of now but I will be vigilant of the volatile news as well as having read various reports stating the oil market is over supplied and is due for a drawback/retracement. There are also reports of Venezuelas halted operations and supply losses from both Venezuela and Iran and if this continues we can see downside for oil, which we have been anticipating for quite some time. This would also pull USDCAD higher in the process but I do not see this happening as of yet with the DXY playing out as expected, seeing the Dollar weaken.
I will be posting my oil chart after the article to my ideas to use in alignment with USDCAD. Remember, there is a NEGATIVE correlation between the two and always remember risk management and only trade in alignment with your own analysis and never follow blindly. Thank you for reading and have a great trading week further !

SPX500USD D1Price has made a bearish engulfing off strong resistance at the 2860 region, breaking price back into the range. Will be watching for additional downside if price can find resistance at the 2815 region. More downside would cause "Risk Off" in the forex market leading to a stronger JPY & CHF..

S&P 500 - SHORT - WEDGE PATTERN - RSI DIVERGENCETHIS IS GOOD IF YOU TRADE THE S&P500 OR USE IT AS A FORM CORRELATION I.E YEN PAIRS


EURUSD / Equities : Complex correlation analysisHope this idea will inspire some of you !
Don't forget to hit the like/follow button if you feel like this post deserves it ;)
That's the best way to support me and help pushing this content to other users.
Kindly,
Phil
