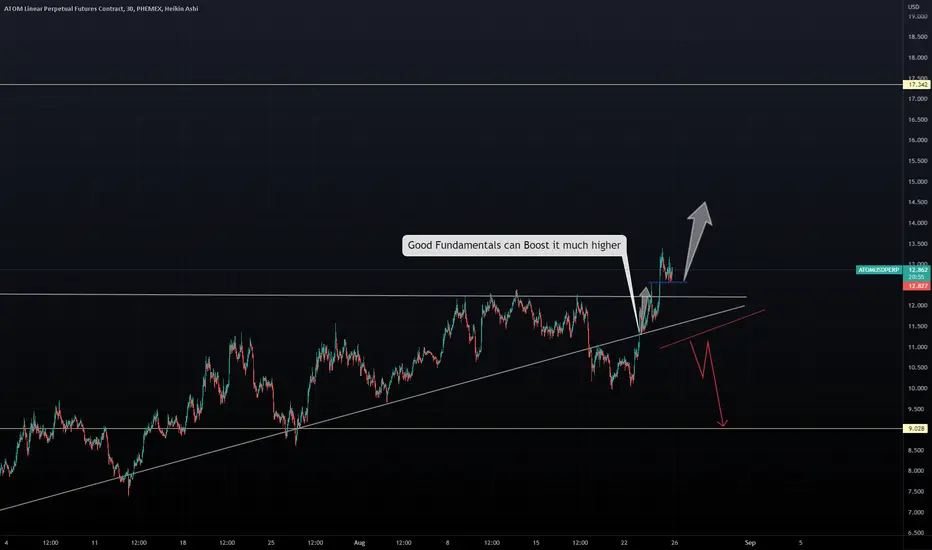
Restarting the cycleATOM has been pumped, and it has been dumped. Capitulation event has passed, allowing market maker to restart the cycle.
One cool thing about "second class" cryptos like ATOM is that they don't even pretend that they are not manipulating the market, they just do it and they make it straight up obvious on the chart. The goal is always to remain attractive to traders with an offer such as this setup. Anything it takes to keep up the high volume and remain at the "top of CMC ranking". That is what brings in the retail money and pays for the entire show.
What is going on now is that the price is kept in this channel as market maker tries to paint it to look as bullish as possible. Expecting the violent move up to $18 as it brakes out of the channel. Pump will likely start as BTCUSD brakes out and starts moving fast.
Stop loss if it closes a candle under the channel.
Cosmos

ATOM formed bullish Gartley | A good buy opportunityHi dear members, hope you are well and welcome to the new update on Cosmos (ATOM) coin with US Dollar pair.
Previously I shared a long-term trade-setup for ATOM, which is still in play:
Now on a 4-hour time frame, ATOM has formed a bullish Gartley pattern.
Note: Above idea is for educational purpose only. It is advised to diversify and strictly follow the stop loss, and don't get stuck with trade

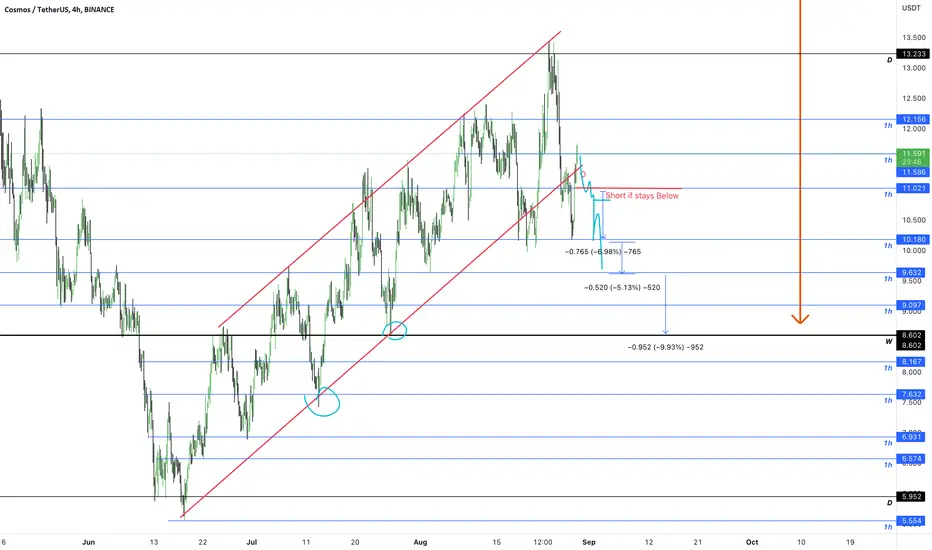
Cosmos shortCosmos bounced off the resistance level. Asset broke trough off the lower boundary of ascending channel. Bearish movement to support level at 10.84 is expected to happen.

ATOM || ATOM USDT || SMC On a Daily TF, ATOM has been quite bullish for sometime, and even though it did tap into a 4H supply zone, it failed to break the structure to the downside, and price bounced back up from the Demand Zone. Expecting the price to break to remain Bullish before tapping into another Supply zone (Refined Zone 14.177 - 15.371 on 4H TF)

Cosmos Hub (ATOM) - September 3Hello?
Welcome, traders.
By "following", you can always get new information quickly.
Please also click "Like".
Have a good day.
-------------------------------------
(ATOMUSDT 1W Chart)
- The key is whether you can climb to the 15.083 section.
- When the Stoch RSI moves out of the overbought zone, the key is whether it can find support near 9.603.
(1D chart)
Primary resistance: 15.083
Secondary resistance: 20.955-23.269
Support: 6.809-9.603
It is necessary to check whether it is supported near 12.380.
If it does not find support, it is likely to move towards the 9.603 level.
- As the Stoch RSI indicator rose before falling to the oversold section, it can be seen that the bearish force is weak.
However, if it fails to rise in the overbought zone and falls, it means that the upside power is also weak.
This weakening of the overall strength increases the likelihood of a sideways movement, so the area around 12.380 is expected to be an important support and resistance point.
- The 15.083 point is the point of support and resistance drawn on the 1M chart, which is important from a long-term perspective.
------------------------------------------------------------ -------------------------------------------
** All descriptions are for reference only and do not guarantee a profit or loss in investment.
** The MRHAB-T indicator, which is inactive on the chart, contains indicators that indicate support and resistance points.
** Background color of Long/Short-S indicator: RSI oversold and overbought sections
** Background color of CCI-C indicator: When the short-term CCI line is below -100 and above +100, oversold and overbought sections are displayed.
** The OBV indicator was re-created by applying a formula to the DepthHouse Trading indicator, an indicator disclosed by oh92. (Thanks for this.)
(Short-term Stop Loss can be said to be a point where profit and loss can be preserved or additional entry can be made through split trading. It is a short-term investment perspective.)
---------------------------------

We got a runner!Longed this last night, and added around 6pm today. Price has been running since.
Just as the price finally broke above the 20dma, we see the price working through its S1 pivot point:
Its always great to tag the bottom, and we potentially have just that. Looking at the weekly price action we see something to be very bullish about. Price could rise substantially into the EMA ribbon (which is sloping downward indicating the bearish trend is still in-tact.)
If price breaks above the ema ribbon, we will add a lot of risk. From here, we will open a decent long and enjoy our 5% passive yield .
The short term trend is very bullish, and this can be exhibited on the 4h with bollingers as price hugs 3StdDev:
The slope of the moving average is also sloping ‘up’. Good entry, but keep risk dialed in.
Good luck trading mates.

ATOM/USDT 1D COSMOS CRYPTOCURRENCIESATOM/USDT 1D BYBIT:ATOMUSDT
price $11.985 bybit perp, bullish for a long to 12.475, take profit on the climb up.
resistance at 12.475, which has been rejected multiple times,(bearish), I would short, with tight stop loss,
combined with being in a rising wedge, channel (bearish) we would need big volume to smash the resistance,
rsi would need to be more oversold in the coming days for me to be bullish, as well increased buy volume.
I am expecting rejection at 12.475, falling to 11.200, then 8.530 at some point in September.
that's my bear case theory. I do like cosmos/atom and am bullish in the long term, I think its a great
project and has many good projects running on it.

Atom 4,5$ next target Atom formed the lower low now
With reversal on stochastic monthly also in weekly
We are going to have another dip

Cosmos longCosmos broke trough the descending trendline. Asset broke trough the resistance level. Bullish movement to resistance level at 13.25 is expected to happen.

Short Atom If falls below $11 we are looking at $10#atom idea if it cannot stay above 11 then we are looking at first target near 10.00-10.20 and then 9.50 area and finally we will see a retest 8.50
ATOM | Macro AnalysisHi guys! Please, support this idea and click the Boost button. Thank you!
Let's start with what COSMOS (ATOM) actually is.
Cosmos is a Proof-of-Stake Layer 0 blockchain, that solves the problems of Scalability, Usability, Sovereignty. In a nutshell, it's the base layer for other blockchains.
The Cosmos Network is a decentralised ecosystem of independent blockchains that can scale and connect with one another.
The world's most used framework for building blockchains is Cosmos SDK. Developers have built hundreds of blockchain projects on Cosmos, including BNB, CRO, RUNE, ROSE, OSMOS and many more. So, it's a fundamental, very solid project that have a bright future.
Now let's talk about price.
ATOM had a steady Uptrend from March 2020 to December 2021. This Impulse unfolded in 5 waves (black 1-5).
In February ATOM broke that Multi Year Uptrend and perfectly retested it in April. Rejection there kicked off the impulsive Wave 3 that took us down to $5.5
We're currently in a corrective wave (4) of that impulsive Wave 3. As we see the ‘Sell the Bounce’ Zone was perfectly touched this week. (Would be ideal to get a test of the 0.618 Fib and rejection there).
The last Wave down (5) is yet to get unfolded. I think it will take the price of ATOM to my Buy Zone between $3.5-4.9 (right where we have the 0.618 Fib from the low to high). That's my main buy zone for the Long term.
There's a stinky bid around that 0.786 Fib just in case. Would be sweet to buy ATOM that cheap.
A sneak peek of the Accumulation, New Uptrend & its Target (just my opinion)
I hope you liked my analysis. What do you think about it? Please do share your thoughts in the comments!
If you like the idea, please, hit the Boost button and subscribe to the profile in order not to miss updates
The information given is never financial advice. Always do your own research

atom/usdt 4hr 4hr rising wedge or ascending triangle, drops to the downside 68% of the time. Atom showing good strength since 22nd august, if bitcoin holds and rises, atom could hit and flip the 200 day ma, $25+ target is identified

ATOM- The Chart i Like to Buy Todaylooking to buy the small correction the past hours and ATOM looks like a good option.
Chart says it all. 12$ support, 11.50 I will be out (if)
The crypto that talks to other cryptos is gaining ground. link
Key points
Several factors, including bullish investment firm analysis, have pushed Cosmos's ATOM up.
Cosmos is an interoperability crypto that offers secure ways for blockchains to work together.
All cryptos carry risk and there could be more clouds on the horizon for the industry.
Why Cosmos is on the up
There's no obvious single reason for Cosmos's strong performance in recent days. However, there are a number of contributing factors that have given ATOM some momentum.
1. Bullish investment analysis
Global investment manager, VanEck, published an optimistic analysis of Cosmos and its potential in the coming years. It praised Cosmos's secure cross-chain bridging capabilities, which is a key issue in the crypto industry. Many blockchains operate as individual silos and have difficulty communicating with other networks. Cosmos is one of the interoperability cryptos that addresses this issue.
VanEck predicts that over 5,000 blockchains will be built on its network before 2030 because of Cosmos's "superior technology." The report says, "The Cosmos Hub's ATOM token is in a premier position to capture a substantial share of the public blockchain market's value, and we expect its price will perform according to this expectation."
2. Internet security is imminent
The VanEck report drew particular attention to something called "internet security." It essentially allows blockchains built in the Cosmos ecosystem to use the Cosmos Hub to secure themselves. A new blockchain can use the existing ATOM-backed blockchain to validate itself, rather than rely on its own -- less developed -- token and chain. According to the Cosmos roadmap, the first step toward launching internet security is due soon.
3. DeFi rumors
Finally, there's speculation on social media that some of the projects from the now-defunct Terra (LUNA) ecosystem will move to Cosmos. Several smart contract cryptos are competing to attract Terra applications. Terra was built using Cosmos technology, adding weight to rumors that some decentralized finance developers will move activities there. However, other blockchains, such as Polygon (MATIC) have launched specific funds to entice former LUNA apps.
Very interesting but let's follow the chart:
I would attempt to buy but under 11$ i would be out again..the market is still dangerous.
one Love,
the FXPROFESSOR
ATOMUSD major bullish break-out. 1D MA200 left.Cosmos (ATOMUSD) has been trading within a Channel Up pattern since the June 18 2022 Low and on Monday started the new rebound leg to the Higher Highs (top) trend-line, exactly on the 1D MA50 (blue trend-line), confirming it as the new medium-term Support.
By doing so, it broke above a major Resistance, the Lower Highs (2) trend-line (dashed line). The next in line is the 1D MA200 (orange trend-line), which is untouched since the April 04 rejection.
Notice that among all this, the 1D MA50 crossed above the 1D MA100 (green trend-line) forming a Bullish Cross, while the Ichimoku Cloud turned green and is supporting right below the price action. The last time this set of events happened, was on August 22 2021, exactly when a massive parabolic rally was starting on ATOM.
--------------------------------------------------------------------------------------------------------
** Please support this idea with your likes and comments, it is the best way to keep it relevant and support me. **
--------------------------------------------------------------------------------------------------------

ATOM- Cosmos Fundamentals demand our attention!The crypto that talks to other cryptos is gaining ground. link
Key points
Several factors, including bullish investment firm analysis, have pushed Cosmos's ATOM up.
Cosmos is an interoperability crypto that offers secure ways for blockchains to work together.
All cryptos carry risk and there could be more clouds on the horizon for the industry.
Why Cosmos is on the up
There's no obvious single reason for Cosmos's strong performance in recent days. However, there are a number of contributing factors that have given ATOM some momentum.
1. Bullish investment analysis
Global investment manager, VanEck, published an optimistic analysis of Cosmos and its potential in the coming years. It praised Cosmos's secure cross-chain bridging capabilities, which is a key issue in the crypto industry. Many blockchains operate as individual silos and have difficulty communicating with other networks. Cosmos is one of the interoperability cryptos that addresses this issue.
VanEck predicts that over 5,000 blockchains will be built on its network before 2030 because of Cosmos's "superior technology." The report says, "The Cosmos Hub's ATOM token is in a premier position to capture a substantial share of the public blockchain market's value, and we expect its price will perform according to this expectation."
2. Internet security is imminent
The VanEck report drew particular attention to something called "internet security." It essentially allows blockchains built in the Cosmos ecosystem to use the Cosmos Hub to secure themselves. A new blockchain can use the existing ATOM-backed blockchain to validate itself, rather than rely on its own -- less developed -- token and chain. According to the Cosmos roadmap, the first step toward launching internet security is due soon.
3. DeFi rumors
Finally, there's speculation on social media that some of the projects from the now-defunct Terra (LUNA) ecosystem will move to Cosmos. Several smart contract cryptos are competing to attract Terra applications. Terra was built using Cosmos technology, adding weight to rumors that some decentralized finance developers will move activities there. However, other blockchains, such as Polygon (MATIC) have launched specific funds to entice former LUNA apps.
Very interesting but let's follow the chart:
I would attempt to buy but under 11$ i would be out again..the market is still dangerous.
one Love,
the FXPROFESSOR

ATOM Price PredictionNext two months, we will explode. I noticed the length between each wave is shortening, and also getting more explosive.

Atom breakout or more rangingShort with tight stoploss at H4 area. targeting lower pivot, H3 and L3. if it breaks H4 it can see H5.
weekly camarilla pivot points.

Cosmos longInversed head and shoulders on Cosmos chart is broken up. Bullish movement to resistance level at 12.2 is possible.

Cosmos Hub (ATOM) - August 22hello?
Welcome, traders.
By "following", you can always get new information quickly.
Please also click "Like".
Have a good day.
-------------------------------------
(ATOMUSDT 1W Chart)
The key is whether it can be supported by rising to the 12.282-15.837 section.
(1D chart)
We need to see support above 9.603 and see if we can move above 12.282.
If it doesn't, it could move towards the 6.809 area.
The 12.282-15.837 section is the section that determines the trend, so if it is supported and rises in this section, it is expected to start the journey to rise to 30.059.
A key point in this rise is the 22.948 point, where you might find resistance, so you need to be careful.
------------------------------------------------------------ -------------------------------------------
** All descriptions are for reference only and do not guarantee a profit or loss in investment.
** The MRHAB-T indicator, which is inactive on the chart, contains indicators that indicate support and resistance points.
** Background color of Long/Short-S indicator: RSI oversold and overbought sections
** Background color of CCI-C indicator: When the short-term CCI line is below -100 and above +100, oversold and overbought sections are displayed.
** The OBV index was re-created by applying a formula to the DepthHouse Trading index, an index disclosed by oh92. (Thanks for this.)
(Short-term Stop Loss can be said to be a point where profit and loss can be preserved or additional entry through split trading. It is a short-term investment perspective.)
---------------------------------

ATOM Ready for correctionAfter quite some uptrend and breaking out of a rising wedge then retesting the bottom trend line and creating a double top I assume it as a MTR and think ATOM is ready to go at least two legs 10 bars down!
NFA

ATOM up up up trend ! ForecastATOM is on trend! waiting for news from the FOMC
Subscribe to tradingview!. stay tuned for ideas! Links below

ATOM long-term Technical Analysis & Price Prediction#ATOM long-term view
If it drops, I think it can test the lower support around $3 this time.
Cheers!
Mr.Cryptotracker

ATOM/USD weekly time frame analysisExpecting ATOM to retest the 25 to 27 level when ATOM pumps.
If volume and buy pressure comes in around 25/27 I’d expect a new ATH.
Simple fib, support/resistance and trend lines that line up with the 25 to 27 dollar levels.
What does everyone think?
