COST headed up from channel bottomCOST will likely reach $315-$320 within the next two weeks. I believe this is the bottom before a swift run up to $312.5+ within the next 13 days. If you want to maximize profit from this move, I recommend buying the $310 calls expiring November 1st for around $0.50. (where they are right now)
COST

Cost Long I may keep it for 307 Buying underlying security or Bull strategies for at least 6 month contracts

COST long ideaI like COSTCO COST here. I see the 200ma on the 3hr chart as a nice support. Looks to be setting up for a new move higher. It's one you can buy and hold IF history is a lesson. 8/crossed the 13 on the 3 hr chart which looks like a buy. Good volume

THE WEEK AHEAD: COST, GDXJ, IWM, CL1!EARNINGS:
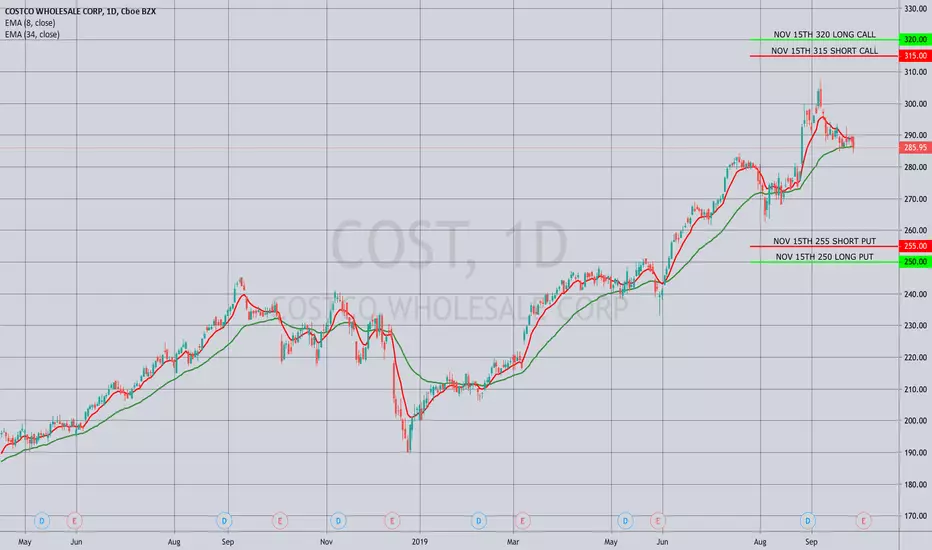
COST (71/29) announces earnings this week, along with THO (89/66), PEP (32/21), and LEN (26/35).
Pictured here is a directionally neutral iron condor camped out around the 14 delta strikes for the shorties paying 1.04 (.52 at 50 max) with break evens at 253.96/316.04, which are slightly wide of one standard deviation. The correspondent short strangle at 215/315 pays 3.74, although you can certainly tighten that up to get a surgical 2x expected move setup at the 260/310, which is paying 5.15.
They're scheduled to announce on Thursday, October 3rd after market close, so look to put on a play in the waning hours of the New York session on Thursday.
Although THO has more ideal volatility metrics, you'll face problems there with 5-wides in the November cycle, and PEP metrics are too low for my tastes to bother with, with 30-day background at 21.
EXCHANGE-TRADED FUNDS
GDX (74/34)
SLV (73/27)
GDXJ (70/38)
GLD (61/15)
TLT (58/15)
XOP (44/41)
I don't know if there's every been a longer period of time in which precious metals have been at the top of the premium stack for such an extended period of time.
GDXJ has the most ideal metrics, with rank >50%, and implied >35%: the November 15th 34/43 delta neutral short strange with the short strikes at the 20 delta's paying 1.22 at the mid.
If you're tired of playing gold, consider a play in XOP: the November 15th 22/23* almost a short straddle short strangle, is paying 2.08.
* -- XOP finished Friday's trading session at 22.51, which is why I'd split the straddle a tad here in the absence of a directional assumption.
BROAD MARKET
Last week saw a bump in volatility, but it still isn't great short to medium term to sell premium in broad market exchange-traded funds.
Running the 10% short straddle test on the highest implied volatility broad market exchange-traded fund -- IWM, shows that you'd have to go all the way out to February (145 days 'til expiration) to get the at-the-money short straddle to pay greater than 10% of the value of the stock; the IWM February 21st 151 short straddle is paying 15.11 versus Friday's closing price of 151.16. Not everyone likes to go out that far out in time, since it takes longer for those types of plays to come in, but would consider something in that cycle if I don't want to play earnings, I have substantial buying power sitting idle, or I'm inclined to a slower, less attention-intensive type of trading.
The IWM February 21st 1 x 2 ratio'd 130/174 short strangle is paying 3.03/1.51 at 50% max, with 1x contracts at the 15 delta on the put side, 2x contracts at the 7 delta on the call side to accommodate skew, with the February 21st 120/130/2x172/2x175 "double double" paying 1.74. Setting up a double double in that expiry is a bit pesky at the moment, since the put side is limited to 5-wides.
FUTURES
/ZF (75/4)
/SI (73/25)
/6B (61/11)
/GC (61/14)
/UB (58/5)
/ZB (58/10)
/ZS (51/22)
/ZN (44/5)
/CL (37/40)
Friskiness in precious metals (/SI, /GC), friskiness in treasuries (/ZF, /UB, /ZB, /ZN), with some volatility left in beans (/ZS) and oil (/CL).
10% Short Straddle Tests:
/SI January 28th 17.5 short straddle: 1.93 versus 17.59.
/CL December 16th 56 short straddle: 7.10 versus 56.18.
I've got /CL setups on in both the November and December cycles, but this implies that it may not be worth initiating premium selling in /CL in the November cycle.
Honorable Mention: /NG (25/44). I pulled the trigger on a UNG play at seasonal lows, after which /NG popped temporarily. It has receded back from mid-September highs around 2.70 and closed Friday around 2.40. Ideally, I'd want in at 2016 lows (<1.75), but that may be asking for a bit much ... .
VIX/VIX DERIVATIVES
VIX ended the week above 17. While an exciting development for short volatility traders, I would keep my pistol in my holster for the time being, waiting for VIX pops to greater than 20 to start legging into bearish assumption positions in either the VIX itself or derivative products like VXX or UVXY.

Close Up Of Previous Idea and LevelsCOST Ideas are attached, had opportunities to get in and ride this ride on up while everyone else thought it had ran too far too fast. Now sitting at an inner resistance area of its lifetime channel. Break above and hold here then opens up 370's-380's next, knocking on the door of 400. Make sure you look at this chart through the correct lens, and don't just take anyone's word for it that its "overbought" or "exhausted" or "parabolic" and has to come down. It isn't and it doesn't. Congrats if you've been in here a while, or if you bought just a few weeks ago. For now just watch price action around this trend line, and trade accordingly. Happy hunting and GLTA!!

Like I Said, Think Again...As mentioned in previous idea about COST (linked) if you think this has run too far too fast, think again. As mentioned then, the critical level is this inner resistance near 300, which if broken can open the floodgates for COST. If it closes 305 convincingly, this thing can feasibly hit 400 without much trouble. Just because a chart looks straight up in "Auto" charting mode doesn't mean it's overextended. Take another look from the right perspective and things become much clearer. Congrats if you bought then. Happy hunting and GLTA!!


This is my play book for EthThis is my playbook for eth at this time bitcoin will be the only factor that changes my outlook

THE WEEK AHEAD: COST EARNINGS; EEM, OIH, XOP, TSLAEARNINGS
COST (46/25) announces earnings on Thursday after market close, so look to put on a play in the waning hours of the regular New York session.
Pictured here is an iron condor in the July (53 days) expiry with the short options at their respective 20 delta strikes. Preliminarily, it's paying 1.55 at the mid price, a smidge shy of one-third the width of the wings, with break evens wide of the expected move at 228.45/266.55 and delta/theta metrics of -1.41/1.93, and a buying power effect of 3.45.
For those who don't like waiting as long for their candy, the June monthly (28 days) iron condor with the shorties set up nearest the 20 delta -- the 230/235/260/265 is paying spot on one-third the width of 1.68 with break evens at 233.32/261.68, delta/theta metrics of -1.65/3.80, and a buying power effect of 3.32.
As of Friday close, the May 31st (4 days) to June volatility contraction is from 34.7% to 24.7% or about 28.8%.
Look to manage intratrade by rolling the untested side toward current price on approaching worthless with a 50% max take profit target.
BROAD MARKET
Majors are at the lower end of their 52-week ranges with background implied in QQQ and IWM in the low 20's; SPY and EFA, in the teens:
EEM (32/21)
QQQ (27/21)
IWM (28/20)
SPY (27/16)
EFA (23/16)
The EEM July 19th 36/40/40/44 iron fly is paying 25% of the width of the longs (8-wide) at 2.05 and break evens right at the expected move of 37.95/42.05, delta/theta metrics of -9.01/1.09, with a buying power effect of 1.95. Look to take profit at 25% max, as you would with a short straddle. Generally, these can't be effectively managed intratrade to delta balance without adding setup, so any trade management has to occur toward the back end of the cycle (i.e., taking untested off at approaching worthless, rolling out tested, selling untested side against in new cycle, assuming that the roll out of the tested and the sell against can be done for a net credit).
QQQ is paying slightly more than one-third the width of the wings for the short option strikes nearest the 20's -- the 163/166/188/191: 1.16 credit, break evens at 164.84/189.16, delta/theta metrics of -3.55/1.55, and a buying power effect of 1.84. Manage intratrade by rolling in untested on approaching worthless toward current price; 50% max take profit.
A similarly delta'd IWM setup is paying 1.06: the July 19th 137/141/159/162, with break evens of 139.94/160.06, delta/theta metrics of -1.82/1.34, and a buying power effect of 1.94. 50% max take profit. Manage intratrade by rolling in untested on approaching worthless toward current price; 50% max take profit.
SECTOR EXCHANGE-TRADED FUNDS
Top 5 By Rank: GDXJ (45/28); ASHR (42/28); OIH (40/37); XLB (41/31); EEM (32/21).
The only short straddle paying in excess of 10% of the value of the stock is OIH with the July 19th 14 short straddle paying 1.51 versus 13.81 spot. The at-the-money short straddle in the closely correlated XOP (30/34), the July 19th 27, is also paying > 10%: 2.82 versus 27.12 spot. Manage intratrade by rolling in untested side on approaching worthless to cut net delta in half without inverting to a width greater than credits received; 25% max take profit.
SINGLE NAME WITH EARNINGS IN THE REAR VIEW
TSLA (62/83). The July cycle iron condor set up nearest the 20's -- the 150/155/235/240 is paying 1.78 at the mid, -31/1.65 delta/theta. Markets are wide, so look to do some price discovery if you want to get in on a play. Manage intratrade by rolling in untested on approaching worthless toward current price; 50% max take profit.


Good time to buy Costco (COST)Weak buy signal with the red+blue cross underneath the Kumo, and lagging strand is showing consolidation. This typically means "wait for more information" but we are approaching a strong support in the trend channel and momentum is pointing towards a reversal.
I'd keep a stop loss around the 238 level, but even if we unload at 247 that's a solid 3:1 risk to reward ratio.


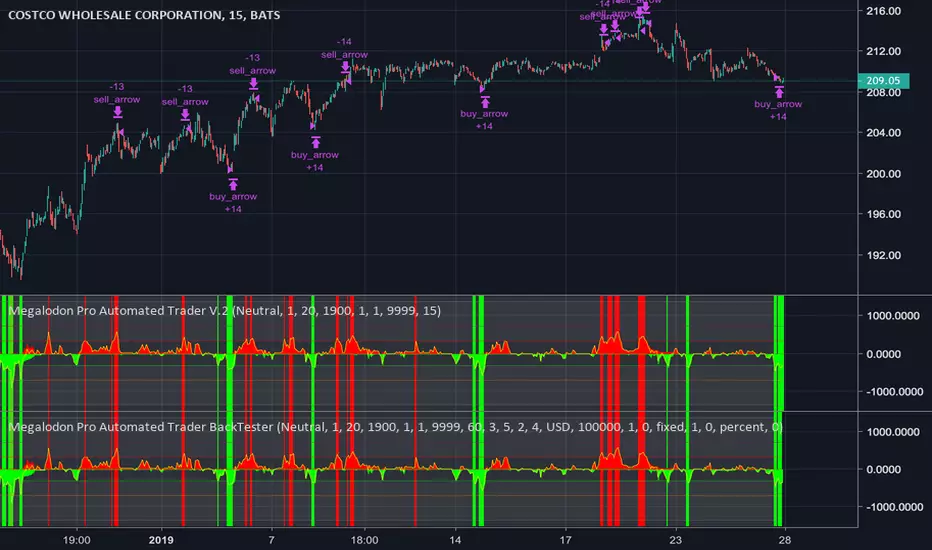
Expect Costco to open on a good noteThe Megalodon Indicators are signifying a strong buy come market open for Costco! This indicator is incredibly accurate! If you'd like to know how to try it out for yourself, just send me a message!
COSTCO... another Amazon's victim? Last reporting data was ok, net sales for the quarter increased 10.8 percent, to $32.28 billion from $29.13 billion last year. Net sales for the first 24 weeks of fiscal 2018 increased 12.0 percent, to $63.40 billion from $56.60 billion last year.
The Company gained an incremental sales day in the quarter due to the shift of Thanksgiving, however pre-Thanksgiving and Black Friday holiday weekend sales fell in the first quarter this year, versus the second quarter last year. This negatively impacted this year’s second quarter sales by approximately 1.4% in the U.S., and slightly less worldwide and negatively impacted E-commerce sales by approximately 7-8%.
However, my expectation for COST is around $220.00, even after rose $170 per share at the end of 2018.
Have a Good Trading Week,
Learn how to beat the market as Professional Trader with an ex-insider!
Cream Live Trading, Best Regards!

$COST Costco at Key Support Level$COST Costco tagging key $200 support level today looking very oversold. Expecting a price recovery into the 1st quarter of 2019. Note there is an un-filled gap below $200 from June of this year - could see us dipping as low as $198 this week. A close this week below $198 would be bearish - ideally we stay above $200.
Targeting mid-December overhead gap-fill of ~$226.50 by mid to late February leading up to March earnings release.
Note: Informational analysis, not investment advice.

COST OverpricedSurprised that COST hasn't fallen farther AH, revenue growth is nice but gross income actually went down Y/Y. Net income increase is strictly from the tax cut and one time events.
31x P/E
1% dividend
When the recession hits, this will get cut in half easily. P/E ratio is way too high, dividend yield too low.
No active position yet, let's see where it opens tomorrow. Holding XRT puts though, expect a retail reaction to Costco earnings, we'll find out tomorrow morning.

THE WEEK AHEAD: ADBE, COST EARNINGS; OIH, XOP, UNG DIRECTIONALSPersonally, I'm not doing a ton here beyond looking at cleaning up remaining December cycle setups and evaluating whether there are poo piles that should be looked at for the taking of tax loss in the margin account before year's end. Nevertheless, here's an outline of what's potentially playable in the coming week ... .
ADBE (81/49) announces earnings on Thursday the 13th after market close. The 20-delta, January 18th 210/270 short strangle is paying a whopping 8.05/contract at the mid price, with the 25-delta January 18th 215/220/265/270 paying greater than one-third the width of the wings at a mid price of 2.13. Markets are showing quite wide at the moment, particularly in the defined risk setup, however, so it may prove unattractive at New York open from a liquidity standpoint.
COST (76/31) also announces on Thursday after market close, but the background implied isn't generally what I'm looking for in an earnings-related volatility contraction play (generally, >50% is where I draw my "picky line").
On the exchange-traded fund front, petro leads the pack, with OIH rank/implied metrics coming in at 95/47, XOP at 79/44, and UNG at 72/86. With OPEC reaching an agreement late last week as to production cuts, I lean toward bullish assumption setups with time to work out/reduce cost basis, since it will take awhile for any cuts to appear in the pipeline. For example: an XOP June/Feb 25/34 upward call diagonal,* 6.55 debit/contract, break even at 31.55 versus 31.54 spot, max profit on setup of 2.45, 72.8% debit paid/spread width ratio. I'm already in a similar OIH bullish assumption setup, which is proving to be a "pulled the trigger" too soon type of thing. The back month in the OIH setup is in April, so I've still got time to reduce cost basis and for the trade to work out in some fashion, even though it's a bit of a rough sled here.
With UNG in particular, I continue to look at a bearish assumption seasonality play, but markets on any given setup have been ugly wide, no matter what type of setup I seem to look at, and lack of liquidity is not your friend when doing an options setup.
For broad market premium sellers: SPY (47/30), IWM (78/25), QQQ (69/27).
* -- Buy the June 25, sell the February 34.

Short COST (Ready to get "Targeted"?)Weekly indicator trendline support broke, divergence, will drop on ER big move.
TP at least 183
[COST] It's starting phase 3Despite the price is over the 30MM, I think it's starting a phase 3. RSI is going down and the strong fall 3 weeks ago is felt.

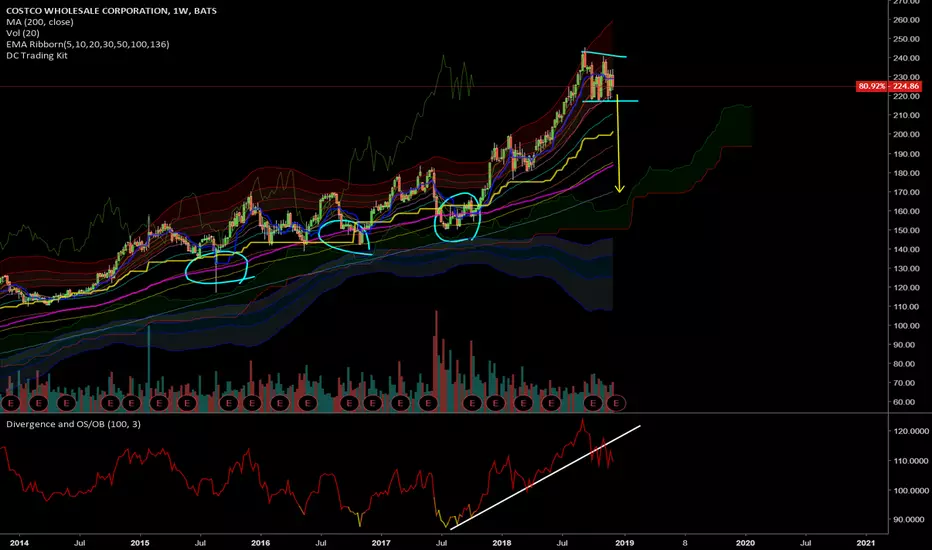
COST: High Risk for Long Term BuyConsidering your risk is something that all investors and traders should do before trading or investing in any stock. Often when a stock displays this much risk on the long- and intermediate-term time frames, it also warns of risk for short-term trading as well. The Weekly Chart provides better perspective of the risk of buying the stock at this new all-time high price. There is no support nearby. See how many points are at risk if a correction occurs?
Trade Wisely,
Martha Stokes, CMT

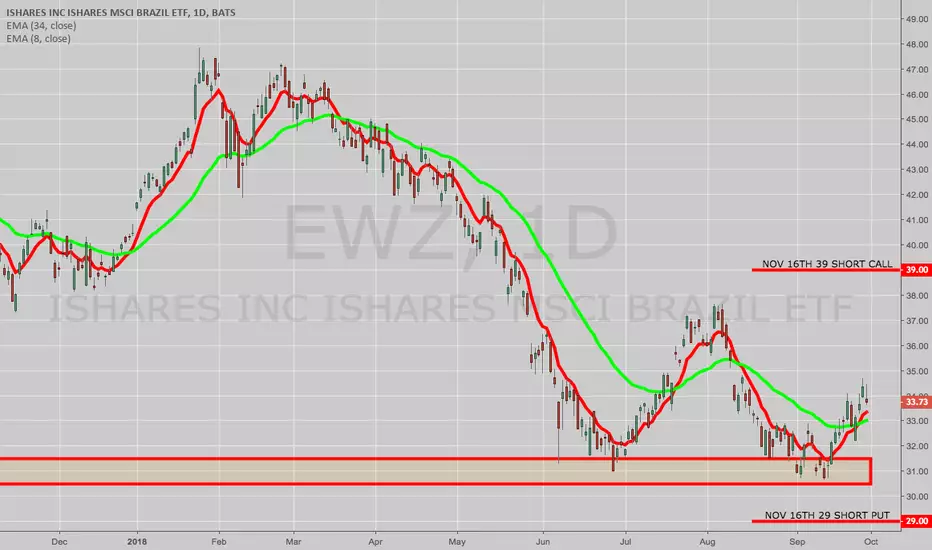
THE WEEK AHEAD: PEP, COST EARNINGS; EWZ, CRON, NIO, IQ, MJPEP announces earnings on Tuesday before market open; COST, on Thursday, after. Neither presents a particularly compelling earnings announcement-related volatility contraction play, with PEP's rank/30-day implied coming in at 30/18, and COST's at 35/23.
With Brazilian elections taking place a week from today (October 7th), it seems to me that an EWZ play is in order if you haven't already got something on: the November 16th 29/39 short strangle is paying 1.59 at the mid with break evens around one standard deevy -- 27.41/40.59. You can naturally go with an October setup, but implied was over 20% higher out in November (44.0% versus 53.2%) as of Friday close, so you're likely to get a little more juice if you go a touch farther out in time.
On the exchange-traded fund side of things, EWZ comes in at the top of the board, with a rank/30-day implied at 79/50, followed by USO at 65/28, and GDX at 50/27.
Non-earnings high implied: CRON: 71/124; NIO: ~/106; MJ: ~/68.0, and IQ: -/61.4.*
Broad Market Majors Background 30-Day: QQQ: 17.2%; IWM: 15.0%; DIA: 13.6%; EFA: 13.3%; SPY: 11.8%.
* -- Neither NIO, MJ, nor IQ have been around for 52-weeks, so they don't currently have a 52-week range to evaluate. I would note that the options liquidity for MJ isn't the greatest, but figured I would throw it in there since weed is hot, and not everyone enjoys paying the single name roller coaster. The MJ November 16th 40 short straddle is paying a whopping 7.45 at the mid, with break evens at 32.55 and 47.45 ... .