Costco Partners Uber to Offer Delivery of Costco ProductsUber Technologies (UBER) announced six new products and features at its fourth annual Go-Get event, including a discounted Uber One membership for college students and an international rollout of Uber Eats delivery service of Costco ( NASDAQ:COST ) products. The ridesharing giant also announced new features for Uber Eats and Health, along with new ways to reserve rides at lower costs.
As of Wednesday, users in select locations across the U.S., Canada, Mexico, and Japan can order a number of Costco ( NASDAQ:COST ) products through the Uber Eats app, whether they have a Costco ( NASDAQ:COST ) membership or not. Uber rolled out its Uber One membership in November 2021, offering discounts on rides and free Uber Eats delivery, among other benefits, and currently has more than 19 million members. The company has decided to expand its potential membership base by offering a discounted version of the membership to college students at $4.99 per month, half the price of the original plan. Uber One for Students is launching now through the fall at an unspecified number of universities across the U.S., Canada, France, Australia, New Zealand, Japan, and Mexico. Sheridan said Uber plans to partner with a number of popular college spots like Domino's (DPZ), Taco Bell, and Starbucks (SBUX) for promotions going forward.
Uber also announced two new ways to plan rides in advance: expanding its scheduled ride system by bringing Uber Shuttle to the U.S., and introducing the ability to schedule an UberX Share ride in advance. Uber Shuttle General Manager Anthony Le Roux said Wednesday that Uber is prepared to bring the service to America later this year. Previously, the company had also partnered with some businesses in the U.S. to take their employees to and from work, but the feature will soon be available directly for users. This summer, Uber said it plans to partner with airports and event venues to coordinate trips to and from sporting events, concerts, and more in cities like Miami and Chicago.
Uber is also expanding its scheduling service with UberX Share, making the lower-cost service one that can be scheduled in advance. A ride can be scheduled as little as 10 minutes ahead of time or days in advance, and the app will tell users once the driver is approaching whether they will be sharing the ride with anyone else.
Starting in July in New York City and elsewhere later this year, Uber Eats users will have the ability to save restaurants and dishes in combined lists, which can also be shared with friends or publicly on the app. Finally, Uber Health users will receive the ability sometime this summer to add a contact from their phone as a designated "caregiver" for them. This could be a big help for those caring for elderly or sick relatives who may not be able to schedule those things on their own.
Uber shares were up 1.4% at 1:40 p.m. Wednesday to $66.25, and have gained over 70% in the last 12 months. Costco Wholesale Corp. ( NASDAQ:COST ) has grown into a major warehouse retailer in the U.S. and abroad by offering low prices on large packages of name-brand products. The company has over 127 million members who purchase long-term memberships to gain access to roughly 860 Costco warehouse stores in the U.S., Asia, Europe, and Latin America, and to make online purchases.
Costco

COSTCO 820 Costco’s stock price has seen a significant increase recently, and there are several reasons behind this rise to $820:
Strong Sales Performance: Costco posted net sales of $19.8 billion for April, up 7.1% from $18.48 billion in the year-earlier period1. Net sales for the fiscal 35 weeks were $166.44 billion, up 7% from $155.62 billion a year earlier.
Shift in Consumer Behavior: Due to rising restaurant prices, many consumers are opting to buy groceries and cook at home instead. This shift in consumer behavior is benefiting grocery businesses like Costco.
Membership Model: Costco’s membership model is also a significant contributor to its success.
The warehouse club’s members pay $60 a year for a basic Gold membership or $120 for an Executive membership, which comes with 2% cash back up to $1,000.
Analyst Upgrades: After reviewing Costco’s strong April sales data, analysts have raised their price targets for the company. For instance, TheStreet Pro’s Chris Versace raised his price target on Costco to $830 from $800. Similarly, Loop Capital analysts raised the firm’s price target on Costco to $840 from $820.
Earnings Expectations: Costco is expected to report earnings on May 30, 2024, for the fiscal quarter ending May 2024. The consensus EPS forecast for the quarter is $3.69, which is higher than the reported EPS for the same quarter last year ($3.43). This positive earnings expectation could also be driving the stock price up.

$COST Misses Holiday-Quarter Revenue ExpectationCostco ( NASDAQ:COST ) missed Wall Street’s revenue expectations for its holiday quarter, despite reporting YOY sales growth and strong e-commerce gains.
NASDAQ:COST Shares fell about 4% in aftermarket trading on Thursday but the stock bounced and surged by about 1.6% in Premarket trading on Friday. The company’s stock had hit a 52-week high earlier in the day.
Earnings per share: $3.92 vs. $3.62 expected Revenue: $58.44 billion vs. $59.16 billion expected
In the three-month period that ended Feb. 18, Costco’s net income rose to $1.74 billion, or $3.92 per share, compared with $1.47 billion, or $3.30 per share, a year earlier.
Costco’s revenue for the quarter increased from $55.27 billion in the year-ago period.
Comparable sales for the company increased 5.6% year over year and 4.3% in the U.S. Excluding changes in gas prices and foreign currency, the metric increased 5.8% overall and 4.8% in the U.S.
Sales of food and sundries, a category that includes snack foods and beverages, were up by mid single digits in the quarter, CFO Richard Galanti said on the company’s earnings call. Fresh foods were up high single digits and nonfoods were up mid single digits.
Ancillary businesses, which includes more service-related purchases like travel, were up by low single digits, he said. Costco’s food court, pharmacy and optical centers were top performers in the quarter and gas was down low single digits as the price per gallon fell.
Costco ( NASDAQ:COST ) has 875 warehouses, including 603 in the U.S. and Puerto Rico. It also has clubs in about a dozen other countries, including Canada, Mexico, Japan and China.
In the second quarter, Costco ( NASDAQ:COST ) opened four new clubs, including three in the U.S. and one in Shenzhen, China. That marked its sixth club to open in China, Galanti said. Two of the three new U.S. locations were Costco Business Centers, which are specifically geared toward small business owners like restaurant operators.
Costco ( NASDAQ:COST ) shares have risen nearly 19% since the start of the year. The stock touched a 52-week high of $787.08 earlier in the day and closed at $785.59, bringing the company’s market value to nearly $350 billion.
Costco's Digital growth
Costco ( NASDAQ:COST ) has made changes to its website to improve the experience for online shoppers. It’s also tweaked its business to be more digitally savvy.
E-commerce sales grew 18.4% in the quarter compared with the year earlier. For example, Costco ( NASDAQ:COST ) rolled out a new mobile app homepage in February, which loads in less than two seconds compared with eight seconds previously — a move he said was crucial since about 60% of its e-commerce business is done through its mobile app and mobile browser.
It rolled out Apple Pay last week to all members online. And it’s adding more merchandise to Costco Next, a seller platform that allows members to buy directly from some of the retailer’s suppliers at a discounted price.
E-commerce sales have also gained momentum as Costco ( NASDAQ:COST ) has gotten better in recent months at touting the value of its online merchandise, particularly for big-ticket items like appliances, mattresses and tires.
App downloads were up 2.8 million in the quarter and and currently total about 33 million, Galanti said.
Membership fees
Costco ( NASDAQ:COST ) has seen more membership sign-ups as the company has cracked down on membership sharing, Galanti said. During the pandemic, he said the warehouse club noticed more people using their mom or dad’s membership card and let it slide. Then, he said, the membership sharing grew because self-checkout became more common at clubs.
Investors have been waiting for Costco ( NASDAQ:COST ) to raise its membership fees for more than a year. The company has typically increased its annual fee roughly every five and a half years. It last hiked fees in June 2017.
But Galanti said the company is not hiking the fee yet. Though he added, “It’s when, not if.”

Box Store Giants: Macro Fib SchematicsWalmart, Costco, Target, CVS, Home Depot, and Walgreens are the largest box store giants in the market. Proctor and Gamble along with Nike are in here because they are both also mega corporations and since P&G has so many products in these stores. Nike is also a staple in these stores but Proctor and Gamble especially belongs here.
These Fibonacci Schematics are extremely clean and probably the best looking structure I have ever seen. This is an excellent example of market mechanics working through Fib Schematics.
If we were to talk about what we see here 2/27/24 then we see....
- Walmart at a couple resistances.
- P&G launching off massive Fib Cluster support.
- Costco testing the waters above and getting ready to jump into next levels.
- Home Depot testing its midpoint from its high with a massive front run from the Thick Orange Fib Line after the actual rejection at the high. This means we are set to launch through the high at 420.
- Target barely rejected the high (FRONTRUN) and found reasonable support on the same supports it FRONTRAN. Target is poised to go crazy high.
- Nike looks like it can do anything.
- CVS also looks like it can do anything but looks more bearish tbh.

COSTSee chart. Nice Wyckoff spring and markup. The consolidation wave may take until May to wrap. Start hunting quality entries.

COSTCO: Potential BuyPrice broke above from the bullish pattern supported by the Ichimoku cloud. I'm expecting the upside momentum to continue. First target around 700 USD.

Honda Bull After earnings or before ? Strong Performance: Honda Motor shares have shown solid relative strength over the last month, tacking on nearly 6% and outperforming the S&P 5001.
Positive Earnings Estimate Revisions: The shares are looking to break out of a multi-year consolidation period, with positive earnings estimate revisions helping drive the move1.
Strong Sales in North America: Honda posted stronger-than-expected earnings for its fiscal second quarter ended September, boosted by strong auto sales in North America2.
Analyst Upgrades: There have been several analyst upgrades for Honda Motor stock. For instance, Morgan Stanley upgraded the stock from Equal Weight to Overweight3. Similarly, Macquarie upgraded the stock from Neutral to Outperform3.
Price Target: While the consensus price target is not available, the stock is currently trading at $32.44
TP 35

APPLE BACK TO 182 SOLID POSITION Long Position:
Key Points:
Strong Fundamentals: Apple has a history of solid financial performance, driven by its diverse product ecosystem, including iPhones, iPads, Macs, wearables, and services. The company's consistent revenue and earnings growth make it an attractive option for long-term investors.
Services Segment Growth: Apple's services segment, including the App Store, Apple Music, and Apple TV+, has been a significant contributor to revenue. Continued expansion and growth in the services sector can provide a more stable revenue stream for the company.
Innovation and Product Pipeline: Apple's commitment to innovation, evidenced by new product releases and technological advancements, keeps the brand at the forefront of consumer technology. Anticipated releases and advancements in products like the iPhone and wearables can drive excitement and demand.
Share Buybacks and Dividends: Apple has a history of returning value to shareholders through share buybacks and dividends. Share repurchases can contribute to stock price appreciation, and dividends provide income to investors.

COST Costco flap and poleHey folks
Back with my signature flag and pole. Not into using crazy indicators here but just pure tech analysis.
COST giving a weekly flag and pole with divergence on macd.
Wait for 8-9 weeks for the next earning season and see it pop. Feel free to checkout my previous ideas and see how they faired.
Leave a comment and a subscribe for more ideas
Cheers
A

For the believer of GOD (Allah)Please it is not a financial advice
I'm sharing my estimated price action
Best of luck,
Your fellow brother 😁

$COST Keeps the Momentum going Despite Market Volatility Despite market Volatility NASDAQ:COST is exhibiting a bullish bias based on the following indicators:
Price Momentum
COST is trading near the top of its 52-week range and above its 200-day simple moving average.
NASDAQ:COST is trading above all of its moving Averages indicating a Bullish Bias.
NASDAQ:COST 50-day Moving Average is above the 200-day moving average also indicating a Bullish Bias.
NASDAQ:COST 50-day Relative strength index is 63.59% higher than the 100-day RSI at 58.84%.
What does this mean?
Investors have been pushing the share price higher, and the stock still appears to have upward momentum. This is a positive sign for the stock's future value.

Costco (NASDAQ:COST) Indicating Positive Sign of a Bullish Trend
Costco wants your loyalty
To some extent, Costco's sales will ebb and flow along with the economy. That's natural for a retailer. But what won't change over the next three years is the company's focus on keeping its customers happy, because that supports an important income stream. And you can keep tabs on that by watching its membership renewal rates.
Costco's Growth
Costco's growth opportunities reside in increasing membership by incremental amounts and opening new stores. Comparable-sales growth is strained right now due to inflation, but the company typically demonstrates mid- to high-single digit percentage comparable sales growth. Membership increased 7.9% year over year in the fiscal fourth quarter (ended Sept. 3), and membership fee income increased as a percentage of sales from 1.88% to 1.95%. It will also likely raise its annual membership fee, which stands at $60 for a basic membership, sometime soon. That will lead to an increase on the bottom line.
If you own this stock, or are considering buying it, making sure that Costco generates consistently high renewals may actually be more important than monitoring its product sales.
Price Momentum
COST is trading near the top of its 52-week range and above its 200-day simple moving average.
What does this mean?
Investors have been pushing the share price higher, and the stock still appears to have upward momentum. This is a positive sign for the stock's future value.

Costco Wholesale Corporation ( NASDAQ: COST) Unravel The GemIn the last five years, shares of Costco Wholesale (COST -0.19%) have made for a wonderful investment, climbing 149%. This gain is much better than the broader market indices. But the stock is still 11% off its peak price (as of Oct. 27).
There is a lot to like about this company. Those looking to buy shares right now need to spend some time understanding more about Costco and the current situation.
With that being said, here are three facts the smartest investors know about this top retail business.
1. A membership-based business model
Anyone can go visit and shop at a Walmart, Target, or Home Depot location. This is typical in the retail industry.
However, Costco does things differently. Consumers must shell out $60 (for the basic plan) or $120 (for the Executive plan) a year to become Costco members, thus allowing them to shop at one of the company's 862 warehouses worldwide. This strategy has been successful, as there are currently 71 million member households, a figure that was up 7.9% year over year. Plus, these memberships registered a renewal rate of 92.7% in the U.S. and Canada in the most recent quarter.
From the company's perspective, this membership model is a financial boon. It drives customer stickiness, which can reduce marketing expenses and support strong revenue gains. It allows Costco to keep the pricing markups on its merchandise under control, as the business isn't trying to maximize product gross margin. And lastly, membership revenue provides a major boost to the bottom line.
Costco also has proven pricing power with its memberships. Costco is due to raise membership fees since it hasn't done so in over six years, but customers likely won't resist if history is any indication. The savings provided by being a Costco member far outweigh the annual fee.
2. An uncertain macro environment
Costco's revenue soared to double digits in both fiscal 2021 and fiscal 2022. The pandemic and its aftereffects spurred demand from consumers to shop at Costco. Perhaps elevated levels of inflation also drove people to these stores, as saving as much money as possible was the priority.
But like many businesses these days, the uncertain macro backdrop is providing a bit of a headwind. Net sales were only up 6.7% in fiscal 2023 (ended Sept. 3), with same-store sales rising 3%. And for fiscal 2024, Wall Street consensus analyst estimates call for revenue to increase 4.9%.
The company's management team points to weaker demand trends as they relate to big-ticket, discretionary items. These include things like electronics and jewelry, for example.
3. An expensive stock
Thanks to Costco's outperformance historically, the stock isn't cheap. It currently trades at a price-to-earnings (P/E) ratio of 38.4. Costco's shares are trading at a value that's more expensive than its past 10-year average of 33.1.
The valuation also represents a huge premium to rivals like Walmart (P/E of 31) and BJ's Wholesale Club (P/E of 18.6). This is likely warranted, as a valid argument can be made that Costco is a superior business to these two competitors.

Costco Wholsale next rally to $613.56Inverse Head and Shoulders formed on Costco Wholesale.
The price broke above and is now retracing to a conservative level. Once it tests, we then need a strong move up.
Now the reason I'd wait for the retest is because American indices are showing further downside to come and it might create this sideways consolidation range following the breakout.
7>21
RSI>50
Target 613.56

COSTCO: Watch this buy breakout level leading to All Time HighsCostco Wholesale Corporation is testing the R1 level (571.65) for the third day straight on a nicely balanced bullish 1D technical outlook (RSI = 60.287, MACD = 2.930, ADX = 22.559). Since the dominant pattern thus far is a Channel Up, if the 1D candle closes over the R1 level, traders should regard it as a bullish breakout opportunity, targeting the R2 level (TP = 612.00) which is the stocks ATH.
## If you like our free content follow our profile to get more daily ideas. ##
## Comments and likes are greatly appreciated. ##

COST show a relatively high level of large-scale triangularCOST show a relatively high level of large-scale triangular
This chart shows the weekly candle chart of Costco's stocks over the past year. The top to bottom golden section at the beginning of 2022 is superimposed in the figure. As shown in the figure, Costco's stock peaked in April 2022, plummeted, and began to strengthen in May 2022, showing a relatively high level of large-scale triangular fluctuations and consolidation overall! The stock of Costco Company was suppressed by the top to bottom golden ratio of 1.382 at its high points in July and September this year. Therefore, in the future, this position can be used as the watershed for judging its strength!

COST Costco Wholesale Corporation Options Ahead of EarningsIf you haven`t bought COST ahead of the previous earnings release:
Then analyzing the options chain and the chart patterns of COST Costco Wholesale Corporation prior to the earnings report this week,
I would consider purchasing the 540usd strike price Puts with
an expiration date of 2023-10-20,
for a premium of approximately $6.30.
If these options prove to be profitable prior to the earnings release, I would sell at least half of them.
Looking forward to read your opinion about it.

COST Costco Wholesale Corporation Options Ahead Of EarningsIf you haven`t sold COST Costco Wholesale Corporation here:
Then Analyzing the options chain of COST Costco prior to the earnings report this week,
I would consider purchasing the 495usd strike price Calls with
an expiration date of 2023-5-26,
for a premium of approximately $9.00
If these options prove to be profitable prior to the earnings release, I would sell at least half of them.
Looking forward to read your opinion about it.

COST - Top StructureThis Structure that is forming within the channel plotted i am comparing against BTCUSD bear run in 2018.
I believe the structure is a top formation with big downsides ahead.
Bars pattern shows the big drop comparison.

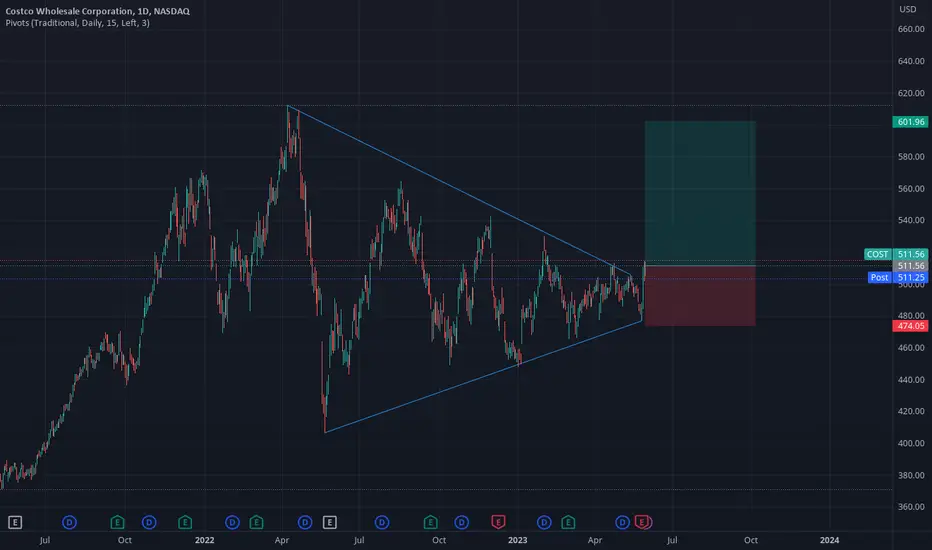
COST WCA - Awaiting a Breakout from SymmetryCompany: Costco Wholesale Corporation
Ticker: COST
Exchange: NASDAQ
Sector: Consumer Defensive
Introduction:
Greetings and thank you for taking the time to read my analysis. Today, we delve into the weekly chart of Costco Wholesale Corporation (COST) which has been forming a symmetrical triangle pattern for the past 12.88 months. This pattern is typically a sign of market indecision, and we're anticipating a breakout soon.
Symmetrical Triangle Pattern:
A symmetrical triangle is a chart pattern in technical analysis used by traders to predict future price movements. It is formed when the price of an asset consolidates between converging trendlines that slope towards each other, creating a triangular shape. The pattern is characterized by lower highs and higher lows, indicating a tightening price range as the market reaches a point of equilibrium between buying and selling pressure. In this case, we have 5 clear touch points on the upper trendline and 3 on the lower trendline.
Analysis:
Costco's price is currently above the 200 EMA, and given the clear uptrend preceding the triangle, we are inclined to see this symmetrical triangle as a bullish continuation pattern. However, the inherent indecision signaled by the symmetrical triangle means we should hold off on calculating a price target until a definite breakout occurs.
Moreover, a breakout must occur soon, as the closer we get to the triangle's apex, the weaker the effect of the breakout. This makes COST a high-priority watchlist candidate that should produce a result soon, regardless of the direction it takes.
Conclusion:
The Costco Wholesale Corporation weekly chart analysis points towards a symmetrical triangle pattern, indicating market indecision and a potential breakout soon. Traders should closely monitor this chart for signs of a breakout.
Remember, this analysis is not financial advice. Always conduct your own research when investing and consider risk management and proper position sizing when trading based on chart patterns.
If you found this analysis helpful, please like, share, and follow for more updates. Happy trading!
Best Regards,
Karim Subhieh

COSTCO neutral patternOn the chart we can see a triangle.
The triangle can breakout in either direction, so we can enter when the breakout occurs.
Target for long and target for short are shown on the chart.

