COST Looks Ready For a 5%-10% RunCOST seems to be about to break past resistance at 307.50 and make a run to $320-$330. Jan 1st $310 calls are only about $1. I think they will get up to $5-$10 by expiration.
Costco

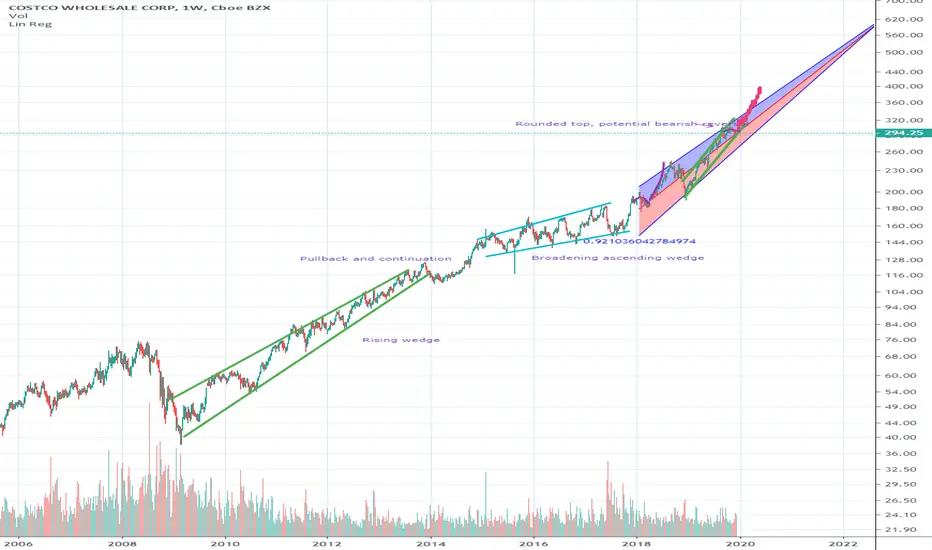
COST Regression analysisPresence of a rising wedge, broadening ascending wedge, Costco has been on a massive bull run. Rounded top also present which may be indicative of a bearish move, but with the strong rising channel and regression trend of 0.92 (strong regression trend according to Pearson's R value) the chart appears definitely more bullish rather than bearish.
$COST ~ COSTCO~ SHORT SETUP USING PUT SPREAD~ #OptionsTradingMETHOD: Short COSTCO {price at entry ~ 292} via:
+2 VERTICAL COST 100 (Weeklys) 27 DEC 19 300/292.5 PUT @5.00 ;
Trading @ low IV after the earnings dump;
Decay helps if price < 294;
Sold high extrinsic put to buy high intrinsic put
STRATEGIES: Using COST day chart:
The 20/50 Mean looks set to make a big pink cloud after a long chart runup.
The Fisher Transform line signaling a continuation short.
The last earnings bailing of stock price turned out to last a few days.
TACTICS: The plan in terms of stock price:
STOP is price > 295 (MUST OBEY, Upside down R:R trade)
TGT1 288 to scale; TGT2 286.25 to exit (NO EARLY EXIT, Upside down R:R trade)
Consider scaling as pink cloud becomes large
We may let the Fisher Transform and 20/50 mean together take us out technically for whatever we get win or lose.
Will update in comments,
B3
d^.^b

$COST Looks Poised to Move Higher@Costco - rising trend channel support, ascending triangle support, already broke out & retested 161.8 Fib. I am still targeting $338. $COST
On a side note, still impossible for me to find parking at my Costco. Always packed.

COSTCO 1D ASCENDING TRIANGLE LONG TRADEAscending Triangles, Triangles, Descending Triangle and Ranges are repeatable trading chart patterns.
Triangles and ranges are consolidation chart patterns that can breakout either direction.
Ascending and descending chart patterns will have a directional bias depending on the previous incoming trend.
Each chart pattern will have defining trendlines of the support/resistance levels creating the pattern.
What ever time frame you are trading this chart pattern, wait for a candle close outside of the trendline in the direction of the breakout candle. (Our time frame preference is the Daily chart).
Add volume indicator - Volume is the amount of $ that went into a particular candle or in Forex the # of trades that took place.
Add ATR indicator - Volatility is the amount of price movement that occurred. Use the ATR to measure the price movement.
When you see descending Volume bars and descending ATR line (which indicates volatility) this shows
a dis-interest in traders to invest in this pair creating consolidation which creates the chart pattern.
Trade Management after there is a breakout candle close.
1 - Position size (compare volume bar to volume ma line).
a - Breakout candle must be 100% of average volume for a full position size.
b - If 75% of average volume then ½ position size. (To find 75% of Volume
look at the charts volume settings – divide smaller # into larger # = 75%+)
2 - Enter two trades.
3 - SL for both trades will be 1.5 x ATR.
4 - 1st trade TP will be 1 x ATR.
5 - No TP on 2nd trade – letting profit run and adjusting SL to follow price.
6 - When 1st TP hit – move 2nd trade SL to breakeven.
7 - Adjust the 2nd trade SL to follow price.
*8 – After Breakout candle – if price closes back into chart pattern close trade
*9 - When breakout candle is more than 1 ATR from breakout candle open.
a - Enter 1st trade at candle close with ½ position size.
b - Enter 2nd trade with a pending limit order that is 1 ATR of breakout candle open.
c – Price should pullback to that pending limit order for 2nd trade.
d – If Price returns back into chart pattern close trade before SL is hit.

COST headed up from channel bottomCOST will likely reach $315-$320 within the next two weeks. I believe this is the bottom before a swift run up to $312.5+ within the next 13 days. If you want to maximize profit from this move, I recommend buying the $310 calls expiring November 1st for around $0.50. (where they are right now)

Cost Long I may keep it for 307 Buying underlying security or Bull strategies for at least 6 month contracts

Costco Due For A Drop to $279Costco has hit a 4H level and is building up momentum to the downside. I will be getting out of the trade on an OPEN and CLOSE of a candle above the pink line on the 4H.

COST long ideaI like COSTCO COST here. I see the 200ma on the 3hr chart as a nice support. Looks to be setting up for a new move higher. It's one you can buy and hold IF history is a lesson. 8/crossed the 13 on the 3 hr chart which looks like a buy. Good volume

Costco Long - trend tunnel low pointTaking Costco to the long side. Got to know about the downgrade from Cramer's Mad Money, so thought to do technical analysis.
Cramer suggested buy at this level and technicals are supporting partially.
I prefer to see divergence in RSI but thats not there. So taking this trade by giving more weightage to fundamentals shared by analysts as Costco is least affected by Trade war of all retailers and usually in economic slowdown Costco do well good.
MACD is crossing above red
Target price is 300
Entry price is 288
Risk:Reward is 1:2


Congrats to Subscribers: Costco Up Over 26% After Alert!It is very easy to read price action if you have a reference point. These support/resistance lines are there to help you read where the buyers and sellers are likely to make a stand.
MasterChartsTrading Price Action Indicators show good price levels to enter or exit a trade.
The Blue indicator line serves as a Bullish Trend setter.
If your instrument closes above the Blue line, we think about going Long (buying).
For commodities and Forex, when your trading instrument closes below the Red line, we think about Shorting (selling).
For Stocks, I prefer to use the Yellow line as my Bearish Trend setter (on Daily charts ).
Be sure to hit that Follow button! Please find me on social networks via the link on my profile page for more ideas from MasterCharts!

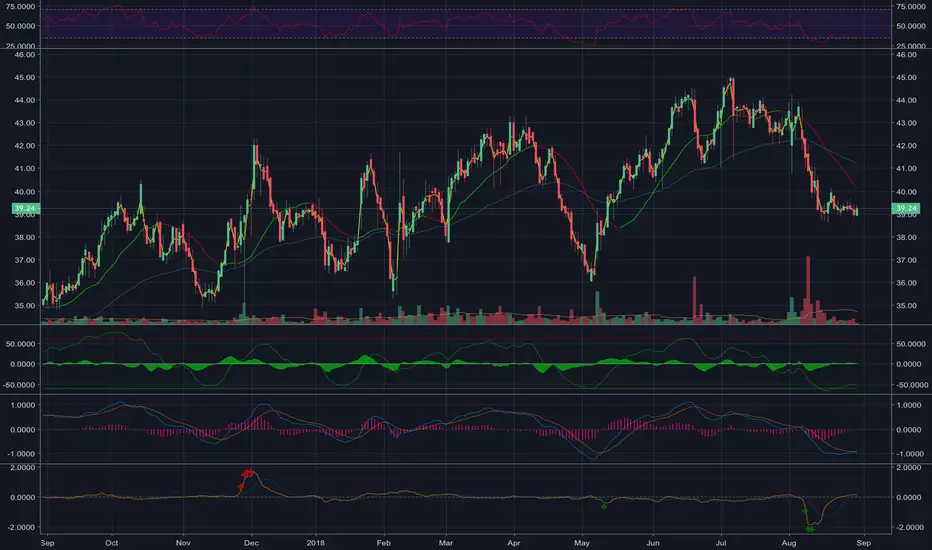
Good time to buy Costco (COST)Weak buy signal with the red+blue cross underneath the Kumo, and lagging strand is showing consolidation. This typically means "wait for more information" but we are approaching a strong support in the trend channel and momentum is pointing towards a reversal.
I'd keep a stop loss around the 238 level, but even if we unload at 247 that's a solid 3:1 risk to reward ratio.

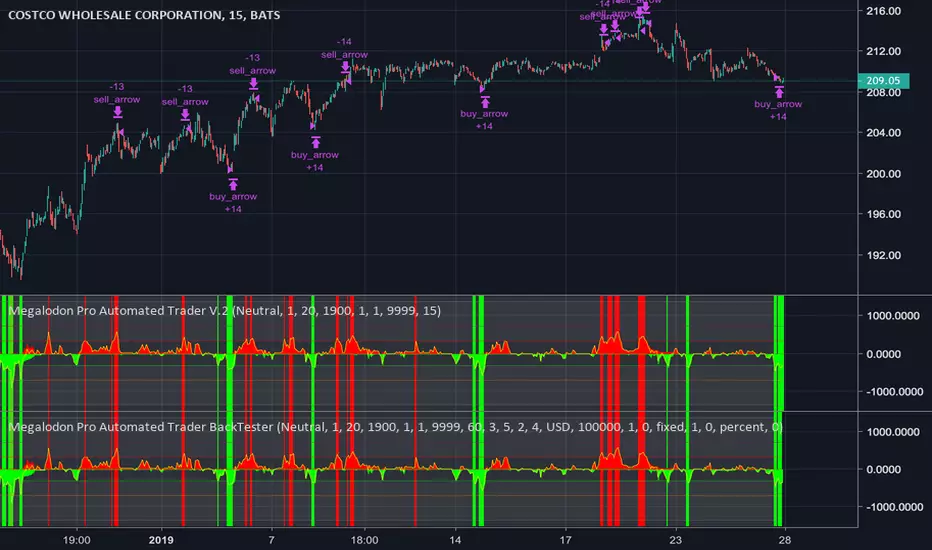
Expect Costco to open on a good noteThe Megalodon Indicators are signifying a strong buy come market open for Costco! This indicator is incredibly accurate! If you'd like to know how to try it out for yourself, just send me a message!
COSTCO... another Amazon's victim? Last reporting data was ok, net sales for the quarter increased 10.8 percent, to $32.28 billion from $29.13 billion last year. Net sales for the first 24 weeks of fiscal 2018 increased 12.0 percent, to $63.40 billion from $56.60 billion last year.
The Company gained an incremental sales day in the quarter due to the shift of Thanksgiving, however pre-Thanksgiving and Black Friday holiday weekend sales fell in the first quarter this year, versus the second quarter last year. This negatively impacted this year’s second quarter sales by approximately 1.4% in the U.S., and slightly less worldwide and negatively impacted E-commerce sales by approximately 7-8%.
However, my expectation for COST is around $220.00, even after rose $170 per share at the end of 2018.
Have a Good Trading Week,
Learn how to beat the market as Professional Trader with an ex-insider!
Cream Live Trading, Best Regards!

COST Inverted H&SNot real bullish on Costco, but charts don't lie. Inverted H&S like the rest of retail (see XRT).
Long on calls for a day.

COST: Sell Short Potential but Strong Support at 200The Daily Chart of COSTCO Stock shows that there is some sell short potential on the short-term trend IF the stock breaks to the downside below the low of around 216. At this time, it appears that is more likely given the lack of large lot buyers in the chart patterns. Support levels show the point gain potential moving down from the current range-bound pattern.
However, COST is less likely to collapse all the way down to 50% from its all-time high. Why? Because it was never speculated to extreme highs, far from a strong support level. The furthest it can go before reaching strong support is around 200 for a bounce and 190 for serious support and risk of rebound price action.

Costco long when stochastic confirmsLooking at stochastic, Costco is out of overbought area. When stoch will turn up, then it is moment to buy

COST: High Risk for Long Term BuyConsidering your risk is something that all investors and traders should do before trading or investing in any stock. Often when a stock displays this much risk on the long- and intermediate-term time frames, it also warns of risk for short-term trading as well. The Weekly Chart provides better perspective of the risk of buying the stock at this new all-time high price. There is no support nearby. See how many points are at risk if a correction occurs?
Trade Wisely,
Martha Stokes, CMT

Costco ascending wedge bearishLooks like a blow off top here! I give it from here to $250 as the tap out point for longers.
Costco ascending wedge is bearish
Price is on resistance of ascending wedge
Price candle body far outside daily upper bollinger band

Stalking for a crash. Good traders stalk 90% of the time and trade only 10% of time. Quote me. :) :)
In this screencast I run through several superhot equities on the monthly time frame.
The higher time frames are often the cause of surprises for people' on 15min - 1H time frames.
Then the end of the screencast I look at the VIX on the 2 hour time frame for signs of nervousness.
I suspect - not predict that something big is coming.

Looks like a run maybe coming soonI like this little stock because my dog loves the dog bed he just got from Costco made by CENT