GBPDon't trade your position in one trade. Allocate in blocks and average them like an institutional trader.
- Noncommercial long positions have increased by 3,6% as short positions have decreased by 4,3%. Long contracts remain less than short with 2K.
- Long commercial positions have decreased by 3% to 80K, as the short have increased by 3,1% to 76K
COT

AUD/USDAUD
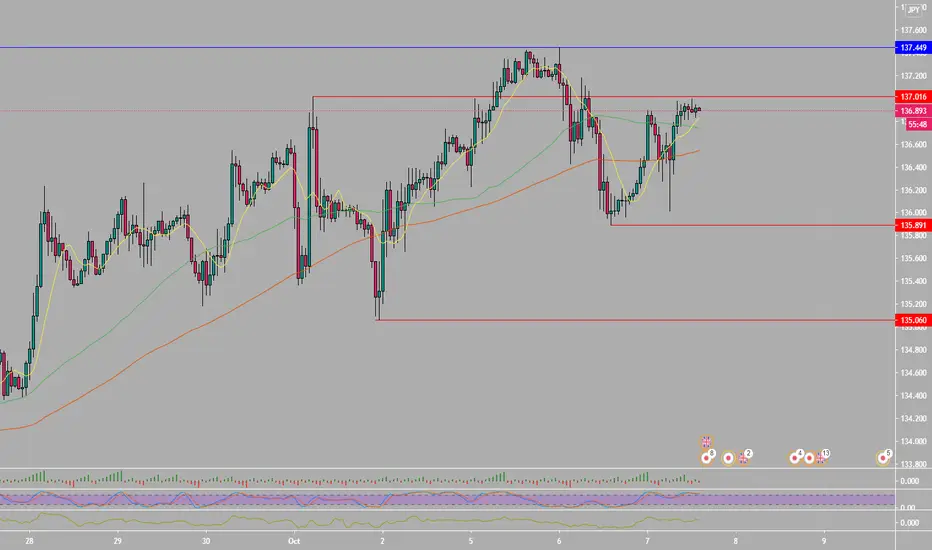
Last week AUD made gains with a rising volume, but the price range is still in a neutral zone. For the time being, no trade is recommended.
If the price breaks the channel upward, it has two resistance zones.
- Sell zone 1, as it is the start of the sell-off 21st September - Strong resistance
- Sell zone 2, a two-year peak - Stronger resistance
- Sell zone 3, every price above the top - Strongest resistance
On these zones, we need to see a lot of supply as sell orders should be allocated based on them.
Remember, supply and demand appear on the opening hours of London and New York, so don't trade on any sign of weakness.
COT
- Noncommercial positions have decreased both, long (-2,7%) and short (-5,6%), as long contracts remain more than short with 7K more.
- Long commercial positions have decreased by 1,8% to 44K, as the short have increased by 1,6% to 60K

EURCHF - NEXT MOVE - COT REPORT - SEASONAL Hello, Traders! We are currently looking for a nice push to the downside from EURCHF. As risk leaves the market once again we can see an Increase in Long orders for CHF as investors move their money into safe bonds and low-interest currencies such as the CHF/JPY. We can also see short orders being added for the EUR over the last two weeks showing a possible change in the overall direction and strength for this currency. Seasonal data shows a decrease in value during the month of October which is expected from the EUR. However, we have yet to see this!

AUDUSD: UPSiDE To Go Hello everyone,
Last analysis paid decently huh? Very one-sided movement.
Anyways, anticipating upside for audusd - expecting 0.71960.
Likely to see that level...
GLGT ;)

AUDCHF_COT_SHORT*SWING TRADER*
*_PATIENCE IS THE VIRTUAL,GOLDEN RATIO I RESPECT_*
*_TRADE WITH PATIENCE LIKE A TURTLE-LIKE A TURTLE SILENT IN IT'S OWN SHELL_*
Backed up with COT data on what Hedge funds are doing we have MORE shorts and LESS longs...AUDCHF has tested the 0.64917 resistance level.
Entry: 0.64932
Stop-loss: 0.65310
Profit target: 0.63615
Ratio: 3.48

AUDCAD_COT_SHORT*SWING TRADER*
*_PATIENCE IS THE VIRTUAL,GOLDEN RATIO I RESPECT_*
*_TRADE WITH PATIENCE LIKE A TURTLE-LIKE A TURTLE SILENT IN IT'S OWN SHELL_*
Backed up with COT data on what Hedge funds are doing we have MORE shorts and LESS longs...AUDCAD has tested the 0.93845 resistance level.
Entry: 0.93848
Stop-loss: 0.94513
Profit target: 0.92217
Ratio: 2.45

USDCAD - Buy BiasI am extremely interested in buys on most XXXCAD pairs but USDCAD in particular. After analyzing the DXY I have a strong feeling that bullish pressure is imminent. I would like to see a pullback into the key area marked followed by significant rejection before I consider my buy position. We need to ensure we see signs of rejection because if we don't we could simply be witnessing a liquidity grab from sellers before the bearish trend continues.
COT Data - 79% Long
IG Client Sentiment Data - 79% Long

GBPJPY - Get that Wick EntryWe managed to pull off an amazing stunt last week with that lovely wick entry on GJ, we are now looking for more potential buying opportunities. I have marked out a zone in which I think price will tap into before continuing to the upside, you may want to consider setting some orders at that region if it fits your analysis.
GBP is proving to be very tough to trade recently giving us a yo-yo of price action movement so make sure you tread carefully when trading it.
COT Data - 53% Short
IG Client Sentiment - 53% Long

CHFJPY - Trend FriendSeveral people will be seeing wick rejections and start thinking this is it, lets buy immediately. The market knows better and will most likely come down to grab liquidity before moving off into our desired direction. I have marked a potential area of interest where you can look to buy, if we get a buy setup at all in these mad markets!
Definitely a good pair to add to the watchlist.
COT Data - 84% Short

EUR|CAD Long OpportunityFX:EURCAD
Leave a like below as well as a comment if this is helpful, it is always much appreciated!
Currently the EUR/CAD is Selling off, looking to retest a recent low at 1.54270
Tomorrow the CFTC will release this weeks COT data report and upon analyzing it, we can have a better idea of the direction that price action is heading. ** I will update this analysis once the report comes out**
If we can see a strong support around the recent low, we can expect bullish continuation which would help shift the MACD above the 0 level as well as crossing the Signal and MACD SMA lines back up indicating bullish action

AUDJPY - Ride itI have a marked area of interest that I will be looking to buy from to my upside target. If we manage to see rejections from this region, I will consider a buy position.
COT Data - 76% Short
IG Client Sentiment - 68% Short

POUND STERLING COT. GJ EXCHANGE COT. All LONG but Fibogroup.
POUND STERLING COT. GJ EXCHANGE COT. All LONG but Fibogroup.
GBP Futures COT CME Big Long / Retail Short. COT GJ Overall Sentiment Long. Most Retail Exchanges Long but Fibogroup in Austria 56% Short.
i don't think i'm aloud to leave links but google FXSSI current ratio. :)
luv u buddys
OANDA:GBPUSD
BRITISH POUND STERLING - CHICAGO MERCANTILE EXCHANGE
FUTURES ONLY POSITIONS AS OF 09/29/20 |
--------------------------------------------------------------| NONREPORTABLE
NON-COMMERCIAL | COMMERCIAL | TOTAL | POSITIONS
--------------------------|-----------------|-----------------|-----------------
LONG | SHORT |SPREADS | LONG | SHORT | LONG | SHORT | LONG | SHORT
--------------------------------------------------------------------------------
(CONTRACTS OF GBP 62,500) OPEN INTEREST: 159,049
COMMITMENTS
39,216 51,961 5,384 88,988 78,464 133,588 135,809 25,461 23,240
Retail Exchanges in the COT
FiboGroup Austria . 56% Short
IGG Chicago
Dukas Swiss,
Saxo Denmark.
Oanda New York
Insta Cyprus . only 50.7% long :slot_machine:
:slot_machine: :slot_machine: :slot_machine:
I’m not short. I'm looking to short. I'm looking to get in and get out. I'm looking to Long Dollar. I'm looking to stack pips into cash. I'm looking for 10 pip 10 lot cup o coffee afternoons. We'll see, someday, til then: self brew'd teaspoons, middle of the night.
GBPUSD Short UpdateGBPUSD seemingly unable to push past the 1.30 mark, still bias short side. monitoring 4hr for entry. COT Heavy bearish.

NZDUSD AnalysisMy analysis based on chart patterns and COT data I think the NzdUsd will be heading down in the near future but wait for clear movements downwards
before entering

$EURUSD Weekly Outlook - To Summarize - ShortCoT has the commercial banks shorting the EURUSD still. Yeah, they added a few long positions this weel, but that was to get back to a level they wanted to add more shorts. They/ve been shorting since the height of the Pandemic swing. so for the Central banks to start being profitable, the price will have to be below 1.13500. If you draw a fib from the start of the EURUSD commercial shorts to the height of the commercial shorts, you can see it unfold in the fib extensions where price wants to reach.
I personally like to see a bit of a larger retracement to the green box notated in this chart during the London/NY session before aggressively going short.
Plus theirs divergence in the 10 year bonds between the currencies. As most are going up, the EUR is taking a dip as of recent.
DIVERGENCE IN 10 YEAR BONDS
Strong Bear tendencies this week. It will be London op and NY open to find the best setups to go short.

AUDUSD big short!!AUDUSD looking like it wants to turn bearish, COT indicates that 6000+ longs were closed and could be a large move to the downside. Looking for a retest of the newly found support that has turned into resistance for my entry

COT Report analysis, 04.10.2020- Educational purposes only!
- Trade at your own risk!
- Main language - Russian
- Pleae drop your questions below and I´ll try to reply during the day.

Eur/Aud Short To 1.62500 LevelWe could see a pull back towards 1.6400 before looking for short opportunity towards 1.62500.
Overall we could see a break to upside based on Cot data so probably we could see institution using the 1.62500 level as liquidity zone for long opportunity but for now i will be looking for short
Follow me for more updates!!

CADJPY AnalysisMy analysis on CADJPY based on COT data and market movements. Looking to go long if the markets presents an opportunity.

GOLD/XAUUSD - Stepping DownIt is rare to see XAUUSD respect descending structure like this as it tends to be a pair that likes to move erratically. If the price continues to step down in a respectful manner, I will be looking to sell after the break and retest as illustrated. I will be closely monitoring the DXY if I consider trading this as it plays a huge role in golds movement. Now that we have broken to the upside on the DXY we may see further downside on XAUUSD to follow.
COT Data - 63% Long

Eur/GBP SELL opportunityWe clearly broke the counter trade line. and structure is now shifting to downside. also price is respecting the fib level while maintaining the lower high.
Target 1=0.91100
Target 2=0.90900
Follow me for more update

EURGBP - Kept SimpleTrade what you see - a structural shift has occurred at the break of the descending trendline, EUR buying is at an all-time high whilst GBP selling is at an all time high. If trade hits TP great if it doesn't on to the next.
Trade was placed with the Alkaline Team.
COT Data - 79% Short
IG Client Sentiment - 56% Short (Great indication for longs)

NZDJPY - Long Term SHORTMacro fundamental scores:
NZD - 7
JPY 62
Commitments of Traders (Hedge Fund Positions)
NZD Short
USD Long
