COTIUSDT Weekly Analysis Potential Reversal?📍 Current Price Position – On Top of Historical Support!
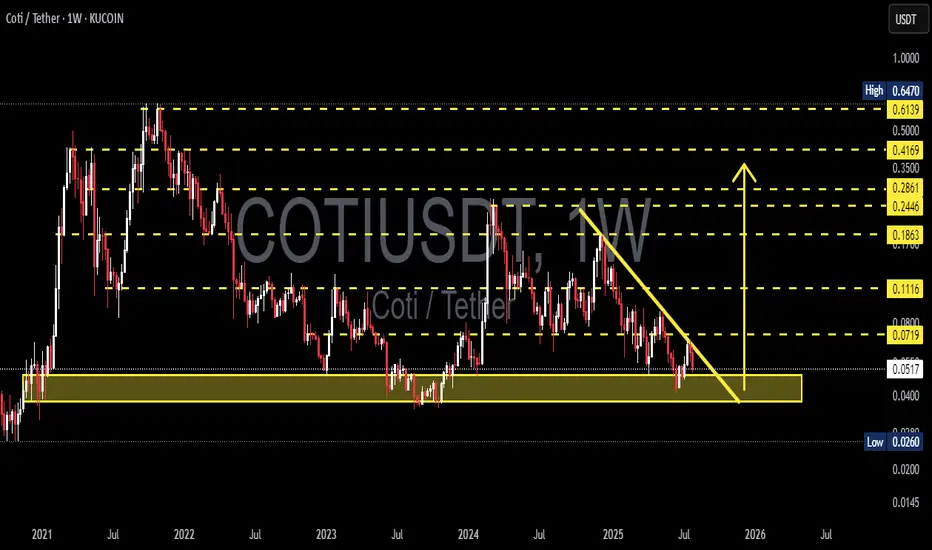
The COTI/USDT pair is currently testing a crucial support zone between $0.0400 – $0.0517, which has been a key demand zone since early 2021. This isn't just any support — it's a macro psychological area that has repeatedly triggered strong reversals in the past.
We are at a make-or-break level, where the next move could define the mid-term trend.
---
🧩 Price Structure and Pattern
📐 The chart shows a descending triangle pattern with:
Consistently lower highs (marked by the downward yellow trendline),
Flat horizontal base around the major support zone.
This pattern can result in:
A powerful breakout if the trendline is broken, or
A sharp breakdown if the horizontal support fails.
---
📈 Bullish Scenario: Reversal Momentum Building?
If price:
Breaks above the descending trendline (~$0.0719), and
Closes a weekly candle above that resistance zone,
➡️ We could see a breakout move with targets at:
Resistance Level Target
Initial Target $0.1116
Mid-Term Target $0.1863
Strong Zone $0.2446 – $0.2861
Long-Term Bullish $0.35 – $0.4169
📌 A confirmed higher high and higher low structure above $0.11 would strengthen the bullish case.
---
📉 Bearish Scenario: Breakdown from Support
If:
Price fails to hold the $0.0517 – $0.0400 support area,
and prints a weekly close below this zone,
➡️ The next bearish targets could be:
Support Level Target
First Support $0.0260
Psychological Level $0.0200
Extreme Panic Zone $0.0150 – $0.0100
⚠️ This would indicate a capitulation phase, likely to trigger panic selling and deeper lows.
---
🧠 Strategy Notes for Traders
✅ For Position Traders:
The $0.040 – $0.0517 area is a prime watch zone for reversal setups with tight stop-loss below $0.040.
Excellent Risk:Reward potential if reversal confirms.
✅ For Swing Traders:
Breakout above the trendline offers a solid entry signal.
Targets up to $0.1863 look achievable with strong volume.
✅ For Conservative Traders:
Wait for breakout + retest confirmation before entering.
Avoid FOMO — let the weekly candle close guide your decision.
---
⚡️ Final Takeaway
> COTI/USDT is at a tipping point!
This long-standing support is the last line of defense for the bulls. A breakout can trigger a macro trend reversal, while a breakdown will extend the downtrend and invite heavier selling pressure.
Watch for the weekly close, trendline reaction, and volume behavior — the next major move is likely just around the corner.
#COTI #COTIUSDT #CryptoAnalysis #AltcoinWatch #DescendingTriangle #BreakoutTrading #SupportAndResistance #PriceAction #ChartPattern #WeeklyAnalysis
COTIUSD
COTI Analysis (1D)The price is breaking out of an important trendline and is also reclaiming a key support zone.
⚠️ Make sure to wait for a daily candle to close above the trendline and the key level, and then enter a position on the pullback.
Targets are marked on the chart.
A daily candle close below the invalidation level will invalidate this analysis.
For risk management, please don't forget stop loss and capital management
Comment if you have any questions
Thank You

COTI - Crazy Breakout Soooooon- COTI is trading inside the falling wedge pattern
- Price is currently nearing the resistance trendline,
- A clear breakout of this trendline will push the price higher
- we will enter a long trade after the breakout
Entry Price: 0.06696
Stop Loss: 0.03793
TP1: 0.07746
TP2: 0.10366
TP3: 0.14599
TP4: 0.25150
Don't forget to keep stoploss
Cheers
GreenCrypto

COTI/USDT – Approaching Make-or-Break Zone | Multi-Leg Reversal📌 Overview:
COTI is currently at a critical inflection point in its long-term structure. After a prolonged distribution phase since 2021 and a steady decline throughout 2023–2025, price action is now testing a historical support zone that has repeatedly triggered strong reversals. This area could be the foundation of a macro bottom formation—or the gateway to further downside if broken.
🔍 Technical Breakdown & Key Price Zones:
🟨 Major Demand Zone (Support Block):
Range: $0.030 – $0.048
This is a historically significant support area, previously acting as a launchpad for bullish impulses.
There is a strong chance of forming a double bottom or even an Inverse Head & Shoulders pattern here on the weekly timeframe, which would hint at a trend reversal if confirmed.
📏 Layered Resistance Levels (Profit-Taking Zones):
1. $0.05600 – Minor resistance, first validation of bullish strength
2. $0.07460 – Previous structural resistance from early 2024
3. $0.08995 – Key breakout level that may trigger mid-term momentum
4. $0.13211 – $0.18230 – Medium-term targets on sustained breakout
5. $0.25157 – $0.41854 – Long-term targets if macro bullish trend forms
🟢 Bullish Scenario (Reversal Setup):
✅ If price holds the $0.030–$0.048 demand zone:
Expect gradual bullish momentum toward $0.05600, followed by confirmation above $0.08995.
Weekly breakout candle with strong volume would confirm reversal structure.
Mid-term price target could reach $0.132 – $0.182, or even higher during an altseason rotation.
🔴 Bearish Scenario (Breakdown Setup):
❌ If the support zone fails:
Price could break below $0.030, exposing $0.0259 or even $0.020 as next downside targets.
This would negate the potential reversal structure and resume the bearish continuation trend.
Traders should wait for a new base or re-accumulation signal before re-entering long positions.
📊 Pattern Focus:
Double Bottom / Inverse Head & Shoulders (Potential Formation)
Descending Channel breakout watch
Volume Drying Up = Possible prelude to trend reversal if volume spikes follow
💡 Trading Strategy:
Aggressive Long Entry: Buy within the yellow support zone, stop-loss below $0.030
Conservative Entry: Wait for breakout and successful retest above $0.056
Bearish Setup: If breakdown occurs, short-term shorts or sidelining recommended
📈 Momentum Outlook:
Weekly structure suggests seller exhaustion is setting in.
Swing reversal is likely if price holds above the support range for the coming weeks.
Gradual accumulation strategy is suitable for swing traders.
🧲 Key Takeaway:
> COTI is entering a golden zone for potential mid-term reversal. If the support holds and a reversal pattern forms, a 200%+ upside is realistic. However, failure to hold this zone could lead to a breakdown and deeper correction. Patience and confirmation are key.
#COTI #COTIUSDT #CryptoAnalysis #AltcoinSeason #DoubleBottom #SupportZone #TrendReversal #TechnicalAnalysis #WeeklyChart #BreakoutWatch

$COTI Approaching Key Long-Term Support!Price is testing a major trendline + demand zone that has held since 2021 👀
If this holds, a move toward $0.09 → $0.108 looks highly probable.
Invalidation below $0.04.
Risk-reward looks 🔥 for long-term swing traders.

COTI/USDT Weekly Analysis – Potential Macro Reversal in PlayThe chart displays a long-term downtrend structure for COTI/USDT, yet a significant accumulation zone is forming around the $0.036–$0.045 range (highlighted in yellow). This area has acted as a key support level multiple times since 2021, suggesting strong demand and a potential bottoming pattern.
🔍 Key Observations:
Macro Support Zone:
Price is currently trading within a strong historical support zone between $0.03607 (multi-year low) and $0.04500, where buyers have consistently stepped in over the past few years.
Potential Reversal Path:
The projected yellow path indicates a bullish scenario with a potential rally from current levels toward a series of resistance levels if a reversal is confirmed.
Major Resistance Levels to Watch:
$0.05046 – Minor local resistance
$0.06500 – Psychological resistance
$0.07403 – Structural level
$0.08998 – Previous rejection zone
$0.12000 – Psychological mid-range target
$0.13210 – Prior support turned resistance
$0.16000–$0.25207 – Key macro targets
$0.46767–$0.69400 – Long-term bullish targets if momentum continues
Bullish Breakout Triggers:
A confirmed breakout above $0.065–$0.074 may trigger momentum-based entries, especially if volume supports the breakout. Sustained price action above $0.12 would further validate the bullish trend reversal.
📉 Risk Management:
This setup is still speculative until a clear reversal structure forms on the weekly timeframe. Invalidation of the setup occurs if weekly candle closes decisively below $0.036.
Conclusion: COTI is currently at a pivotal zone. While the broader trend has been bearish, the current setup offers an attractive risk/reward for mid to long-term bulls if reversal confirmation appears. Watch for bullish weekly structure and volume expansion to validate the thesis.

COTIUSDT 1W AnalysisCOTI ~ 1W Analysis
#COTI Buy gradually from here if you still have confidence in this coin with a short term target of at least 15%+ from here.

COTIUSDT 1D AnalysisCOTI ~ 1D Analysis
#COTI Buy back gradually from here if you still have confidence in this coin with a short term target of at least 15%+ from here.

COTIUSDT 1D AnalysisCOTI ~ 1D Analysis
#COTI Buy after successfully penetrating this resistant line with a short -term target of at least 10%+ from here.

#COTI/USDT#COTI
The price is moving within a descending channel on the 1-hour frame, adhering well to it, and is on its way to breaking it strongly upwards and retesting it.
We are seeing a rebound from the lower boundary of the descending channel, which is support at 0.06870.
We have a downtrend on the RSI indicator that is about to break and retest, supporting the upward trend.
We are looking for stability above the 100 Moving Average.
Entry price: 0.06870
First target: 0.07471
Second target: 0.09799
Third target: 0.08660

#COTI/USDT#COTI
The price is moving in a descending channel on the 1-hour frame and is expected to continue upwards
We have a trend to stabilize above the moving average 100 again
We have a descending trend on the RSI indicator that supports the rise by breaking it upwards
We have a support area at the lower limit of the channel at a price of 0.07800
Entry price 0.08236
First target 0.08376
Second target 0.08576
Third target 0.08878

#COTI/USDT#COTI
The price is moving in a descending channel on the 1-hour frame and is adhering to it well and is heading to break it strongly upwards and retest it
We have a bounce from the lower limit of the descending channel, this support is at a price of 0.08530
We have a downtrend on the RSI indicator that is about to break and retest, which supports the rise
We have a trend to stabilize above the moving average 100
Entry price 0.08863
First target 0.09110
Second target 0.09362
Third target 0.09677

COTIUSDT 5DCOTI ~ 5D Analysis
#COTI Currently continuing to maintain this support block. Buy gradually from here if you still have a Conviction on this Coin with a minimum target of 15%+.

Coti Monthly AnalysisIn the monthly timeframe, the green box area is crucial for creating an upward trend to reach the specified targets on the chart.
If the closing price falls below the green box, there is a possibility of reaching $0.01885.

#COTI/USDT Ready to take off upwards#COTI
The price is moving in a descending channel on the 1-hour frame and is adhering to it well and is heading to break it strongly upwards
We have a bounce from the lower limit of the descending channel, this support is at a price of 0.06000
We have a downtrend on the RSI indicator that is about to be broken, which supports the rise
We have a trend to stabilize above the moving average 100
Entry price 0.08850
First target 0.1020
Second target 0.10810
Third target 0.1147

#COTI Getting Ready for a Mega Bullish Wave | Key Levels Yello, Paradisers! Is #COTIUSDT about to break out, or are we heading for a bearish breakdown? Let's break down the latest setup of #COTI:
💎The current falling wedge formation on the 8-hour chart is showing high potential for a bullish reversal. This pattern, coupled with a liquidity sweep at the lower boundary, has already shaken out impatient traders. But remember, no move is confirmed until we see a decisive breakout. #COTIUSD is moving to retest the descending resistance.
💎 OTC:COTI is facing a tough resistance at $0.142, aligning perfectly with the descending wedge’s upper boundary. A clean break and close above this level on the 8-hour timeframe could spark a rally toward the $0.18–$0.19 major supply wall, where sellers are likely to pile in.
💎On the downside, $0.09719 remains a strong support zone, where buyers have historically stepped in. If #COTI closes below this level, we may see a sharper decline toward the $0.077 demand zone, which is the last line of defense for bulls.
💎A close below $0.07780 would invalidate the bullish setup entirely and signal a potential plunge to lower lows. This breakdown would open the door for further bearish momentum, with sellers fully in control.
Stay focused, patient, and disciplined, Paradisers🥂
MyCryptoParadise
iFeel the success🌴

COTIUSDT 1WCOTI ~ 1W
#COTI If you still have Conviction on the coin,. this support block would be a very good buying place for now. buy in stages with a minimum target of 20%+

#COTI (SPOT) entry range(0.07800- 0.09800) T.(0.198) SL(0.07312)BINANCE:COTIUSDT
entry range(0.07800- 0.09800)
Target1 (0.14180) - Target2 (0.198)
1 Extra Targets(optional) in chart, if you like to continue in the trade with making stoploss very high.
SL .1D close below (0.07312)
*** collect the coin slowly in the entry range ***
*** No FOMO - No Rush , it is a long journey ***
**** #Manta ,#OMNI, #DYM, #AI, #IO, #XAI , #ACE #NFP #RAD #WLD #ORDI #BLUR #SUI #Voxel #AEVO #VITE #APE #RDNT #FLUX #NMR #VANRY #TRB #HBAR #DGB #XEC #ERN #ALT #IO #ACA #HIVE #ASTR #ARDR #PIXEL #LTO #AERGO #SCRT #ATA #HOOK #FLOW #KSM #HFT #MINA #DATA #SC #JOE #RDNT #IQ #CFX #BICO #CTSI #KMD #FXS #DEGO #FORTH # AST #PORTAL #CYBER #CLV #RIF #ENJ #ZIL #APT #GALA #STEEM #ONE #LINK #NTRN #COTI ****

COTIUSDT 1WCOTI Update ~ 1W
#COTI If you still have Conviction on the coin,. this support block would be a very good buying place for now. buy in stages with a minimum target of 20%+

#COTI/USDT Ready to go higher#COTI
The price is moving in a descending channel on the 1-hour frame and sticking to it well
We have a bounce from the lower limit of the descending channel, this support is at 0.1150
We have a downtrend on the RSI indicator that is about to be broken, which supports the rise
We have a trend to stabilize above the moving average 100
Entry price 0.1225
First target 0.1304
Second target 0.1390
Third target 0.1483


COTIUSDTCOTI ~ 6D
#COTI So far it continues to maintain this support block. if you have Conviction on this coin,. This support block would be a very good buy for now.

COTIUSDTCOTI ~ 1D ✅
#COTI Managed to break this descending resistance with strong volume. and now faced with local resistance here. If retesting occurs,. This would be a good opportunity for short-term buying.
