COTIUSDTCoti is at a critical situation if the chart (the last candle on the yellow line closed below yellow line the chart will go for dip and/or close above the yellow line can be count as a pullback and fully strength complete its bullish trend) fails or success with the yellow line which is a price action support the rest of the chart will be somehow available and clear for opening contracts to earn profits
COTIUSDT

COTI CUP AND HANDLE MID TERMAs you can see in the chart of COTI-USDT pair... it's forming a Cup and Handle pattern which is a bullish sign.
Tripple bottom in the 4 hours chart.
If the bitcoin dominance drops to a certain level... then we could witness the start of an Altseason again!

COTI breakout and it will fly - Altseason 2021 prepCOTI has all the fundamentals and on the T.A side its a beauty.
Bug news coming in the next 2 weeks.
This chart reflex my view for the short term - 2-4 weeks.
For the mid term it could easily go to 0.18-0.20$.
Targets are on chart.

#COTIUSDT weekly setup about to explode?COTI looks about ready to explode to the upside. Bullish price action, lowering volume.
Once the bearish OB's are tested and broken, there are hardly limits for it to find a new ATH.


COTIUSDT IN ASENDING CHANNEL, BREAK OR SUPPORT?Hi guys, thanks for tracking our Analysis, COTI is in a key situation and we expect COTI can hit upper peaks if BTC lets!
let's see other information in the pic thanks.

Read the chart and say out loud: LONGBesides the interesting fundamentals, I am bullish on COTI for a number of signals from the charts. I apologize for the confusion in the drawings but that was necessary.
The September drop caused a sell-off that, coincidentally with rising BTC.D, caused the price to fall down and eventually lose the ascending trendline in green (aka lower boundary of the rising channel)
We gained back EMA200, then EMA100, and now trying to drive up the faster EMAs
Price already reached 618fib from ATH to November lows, now printing HHs and HLs
Daily close above $0.05 will be bullish, although we're facing a resistance zone at $0.0505-$0.057 which makes such entry riskier than usual: if you want to play it safer wait for breakout and retest of the same levels.
If you're swing trading, SL could be set below the upper boundary of Ichimoku cloud or EMA100
Not financial advice.
Best from Nips
cotiusdtBINANCE:COTIUSDT
Hello friends, my name is Mustafa (Mr.MB).
I hope you are healthy wherever you are and a smile on your face.
Well, coti currency friends are moving in the uptrend channel and you can move to the bottom of the next area by stabilizing the price at the top (break and pullback) of each green area.

cotiusdtcoti is forming symmetical triangle formation ...breakout is done ...retest is also done ...


Another Bullish run on COTIUSDT?Technical analysis and flag pattern says that another bullish run is on the way!

COTI/USD- we are in the middle of UP trend. Welcome folks
I can say we are in the middle of the Uptrend. And there are no signals that it has finished yet.
Open this lesson, where you will learn 3 simple Examples of how you should trade crypto during a strong trend.
P.S. Below there so many useful links. Open all of them

figure cup with handleShare your opinion in the comments and support the idea with likes.
Thank you for your support!

$COTI : need for speed ...$COTI need to break the weekly resistance to run
We wait for a break & restest with volume
Be careful with $BTC & possible pullback

COTIBTC_DailyPrice: 281 Satoshi
Entry Level: 273-283 Satoshi
TP_LVL I: 299 Satoshi
TP_LVL II: 337 Satoshi
TP_LVL III: 375 Satoshi
SL: 234 Satoshi
Expected Return: 33 %
Reward/Risk: 2

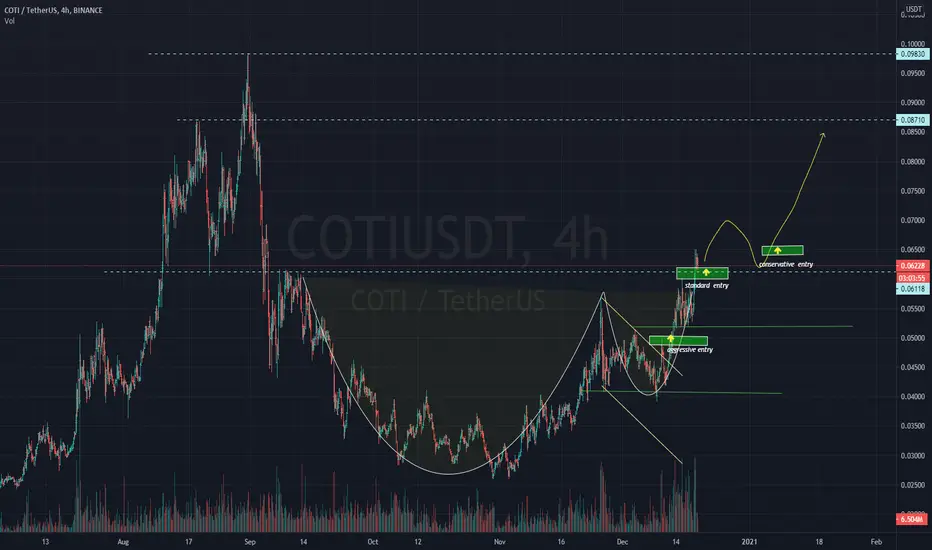
✳️COTI/USDT Analysis (14/12) #COTI $COTIAfter breaking out of the downtrend at 0.05$, now COTI is heading to 0.06$, if it conquers this zone, it will strongly increase to 0.09$ with Cup & Handle pattern from September until now.
However, if COTI falls back and loses the 0.05$ zone, it becomes a false break and as a result COTI will fall back to 0.035$ or even 0.02$
📈BUY
-Buy: 0.0475-0.05$.SL if B
-Buy: 0.057-0.06$ if A.SL if B
📉SELL
-Sell: 0.057-0.06$ if B.SL if A
-Sell: 0.0875-0.09$ if B.SL if A
♻️BACK-UP
-Sell: 0.0475-0.05$ if B.SL if A
-Buy: 0.035-0.0375$ if B.SL if A
-Sell: 0.035-0.0375$ if B.SL if A
-Buy: 0.02-0.022$ if B.SL if A
❓Details
Condition A : "If 1D candle closes ABOVE this zone"
Condition B : "If 1D candle closes BELOW this zone"

COTIUSDT is going to be bullishCOTI trend formed a nicely cup and handle pattern and is going to be bullish

My Crypto Combo Long Trades 20201210My Crypto Combo Long Trades
COTIUSDT, MKRUSDTP, TFUELUSDT, BELUSDT
Trade close manually when: the above ribbons turns Yellow or better Red.
I appreciate your like or comment. Welcome to share your idea here.
DISCLAIMER
This is only a personal opinion and does NOT serve as investing NOR trading advice.
Please make your own decisions and be responsible for your own investing and trading Activities.

COTI Cup and Handle breakout price break the cup and handle ready to move higher
Buy below 255 sats
stop : 200
Target : 280 , 320 , 385 , 450


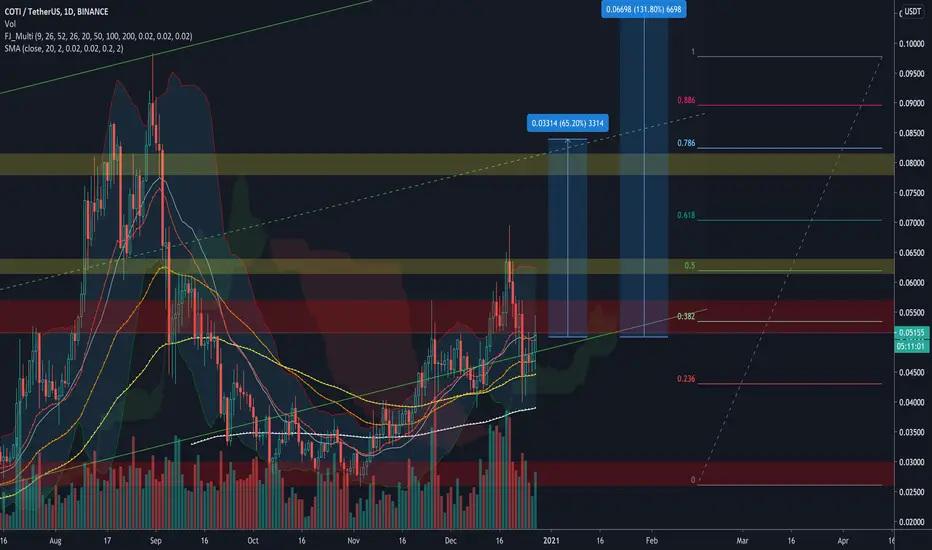
COTIUSDT - CUP and HANDLE forming !?!?!?Hey Crypto Nerds,
Taking a look at COTI and can definitely see a nice CUP and HANDLE forming on the 1D.
I've mapped out a Trailing Take Profit at the 0.618 FIB @ 0.07133, as I expect this to reach well over the black line I've marked out.
COTI also has alot of updates coming fundamentally this month which will coincide with the TA above in my opinion.
ENJOY!
Activeaus
