Coti Breakout Confirmed Coti Is Already In Strong Uptrend And Recently Breaks Multiple Resistances Too Falling Wedge And Horizontal Resistance
Also Good Reports Are Coming Fundamentally Too Expecting Massive Bullish Wave In Coming Days
Expecting 2x Bullish Wave In Coming Days
COTIUSDT

COTI/USDT Ready for Another Big Leap or Will it Fail?Yello Paradisers! Are you ready to seize the next big opportunity with #COTIUSDT? Let's dive into this exciting analysis's details and ensure you stay ahead of the game.
💎#COTIUSDT is showing signs of a probable bullish continuation from a support zone at $0.0967. We have observed #COTI following a descending channel for a long time. Recently, after breaking above descending resistance, it’s restoring momentum at the key support.
💎If the price successfully holds momentum at this support level of $0.0967, there is a great probability of a bullish ride, similar to previous behavior at this level. If #COTI manages to break above the probable resistance at $0.144, it will likely target the next resistance zone and beyond.
💎However, if the price fails to hold momentum at the key support, we’re expecting a probable bullish rebound from the lower demand zone around $0.066.
💎It's vital to maintain vigilance and closely observe #COTI price movements. A breakdown below the demand & Bullish OB area, confirmed by a daily candle closure, would challenge the bullish scenario and could result in further declines.
Stay focused, patient, and disciplined, Paradisers.
MyCryptoParadise
iFeel the success🌴

Is COTIUSDT About to Explode or Collapse? Read Now to Find Out!Yello, Paradisers! Have you been following #COTIUSDT's recent moves? Let's dive in.
💎#COTI has successfully reclaimed its support level, signaling bullish momentum. Currently, the price sits on this support after a failed breakout attempt of the descending resistance. A rebound at this support level is crucial. If COTI breaks out of the descending resistance, we could see a significant upward move toward our target resistance area.
💎However, if COTI fails to bounce and breaks down from the support area, the price may revisit the demand zone. This zone has large buy orders, and a hit here could lead to a significant rebound back upwards.
💎If COTI fails to sustain above the order block (OB) area of 0.65, a breakdown would invalidate the bullish outlook, potentially signaling a bearish trend with the price moving further downward and dipping.
If you want to be consistently profitable, you need to be extremely patient and always wait only for the best, highest probability trading opportunities.
MyCryptoParadise
iFeel the success🌴

COTI buy setupCOTI has a bearish structure. There is a liquidity pool at the bottom of the chart. It is expected that this pool will be swept and the price will reach the demand range.
We are looking for buy/long positions in the demand range.
Closing a daily candle below the invalidation level will violate the analysis.
Note that the financial market is risky, so:
Do not enter any position without confirmation and trigger.
Do not enter a position without setting a stop.
Do not enter a position without capital management.
When we reach the first TP, save some profit and try to move the stop continuously in the direction of your profit.
If you have any comments please post them, comments will help us improve our performance
Thanks

COTI/USDT READY TO TAKE OFF! ACCUMULATE HERE!!Hey everyone! If you're enjoying this analysis, a thumbs up and follow would be much appreciated!
COTI/USDT looks good in the daily chart. According to the chart, it is forming a descending triangle and holding the support of a lower trendline. Accumulate it in the green box.
Entry zone:- Buy some at CMP and add more up to $0.082
Targets:- $0.12/$0.146/$0.174/$0.202/$0.238
Invalidation:- Daily close below $0.08
What are your thoughts on COTI's current price action?
Share your analysis and questions in the comments below!
Thanks!

Substantial challengeCOTI is currently nearing a critical daily resistance level at $0.09925. Should the price successfully break above this level, it indicates the potential for further upward momentum. The next significant resistance to monitor would be at $0.1300, as shown on the chart. This level could present a substantial challenge for the price to overcome.

COTI/USDT POTENTIAL BREAKOUT!Hey everyone! If you enjoy this content, please consider giving it a thumbs up and following for more analysis.
COTI looks good here. Breaks out from the triangle and currently retesting it. Buy some here and add more in the dip.
Entry range:- $0.128-$0.138
Target:- 150-220%
SL:- Daily close below $0.12
Let's Discuss!
What are your thoughts on COTI's current price action? Do you see a bullish pattern? Share your analysis in the comments below!

#COTI#COTI is in a good position and is ready for a big rally.
The price has started to grow from the support level of $0.090 - $0.1030 . But this is still the beginning of its ascent path. Big profits can be made from it.
The price is now almost at the bottom and is compressed for a move and at least 100% growth.
The momentum is strong , and the trend seems very upward.

COTI coin is setting up for upto 20% pumpHi dear friends, hope you are well and welcome to another new trade setup of COTI coin.
Previously we caught almost 17% pump as below:
Now on a daily time frame, COTI with BTc pair is about to complete a bullish Gartley move for the next pump.
Note: Above idea is for educational purpose only. It is advised to diversify and strictly follow the stop loss, and don't get stuck with trade.

coti coti looks bullish here already in uptrend and breaking bullish pennant consolidation too expecting successful breakout soon
incase of successful breakout expecting 2x bullish wave keep eyes on coti for breakout

COTI/USDT upward momentum from demand? 👀🚀COTI analysis💎 Paradisers! We are currently witnessing #COTIUSDT showing a high probability of bullish continuation from the demand zone.
💎 After closely monitoring the price action, we've seen OTC:COTI break above its descending resistance. It's now positioned for a bullish continuation from the demand zone at $0.9994. Interestingly, this demand level has been respected twice before, and we anticipate that it will be honored once again. If the momentum sustains at this level, we expect a strong bullish wave aiming for the resistance levels mentioned above.
💎 Another point to consider is the diminishing intensity of the rejections at this demand level, indicating a potential weakening. Should this level break, we're prepared to capitalize on a bullish rebound from the lower bullish Order Block at $0.06420. The substantial liquidity at this level suggests that #COTI could experience a robust bullish rebound. However, a break below this OB level could lead to a significant downward movement.
MyCryptoParadise
iFeel the success🌴

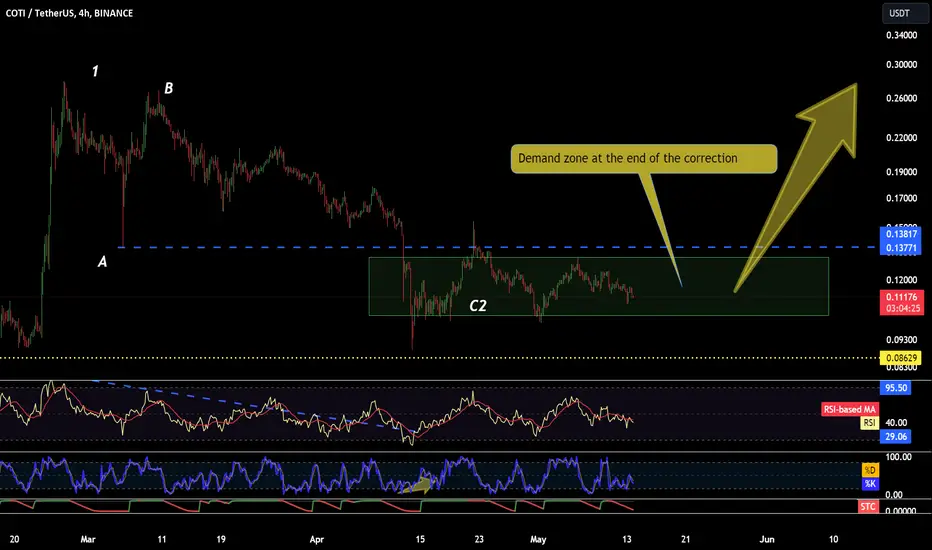
Will COTI find a way out?Hello. Today we are looking at COTI cryptocurrencies. Recently we saw a strong upward move, which was caused by fundamental information. At this point, we can see a clear corrective structure with a clear entry zone. The entry condition is the breakout of the low of wave A and low RSI on the H4-D1 intervals. We should look for a candle formation in the zone. The target for this trade will be a new top. This is a SPOT and leverage zone.
COTI ANALYSISHi Everyone!
COTI Analyze ( COTIUSDT), 1-day time frame ⏰
COTI has broken out from a triangle pattern
The breakout from the triangle pattern presents a potential buy setup
- if COTI can continue pump, first target is 0.15094 - 0.16086
- and You can Buy Limit in Support area 0.10960
GoodLuck Guys!
*Follow For More!
*DYOR

📈🚀 COTI Trade Plan! 🚀📈📊 Analysis:
Squeeze Formation: COTI is currently experiencing a tight squeeze between the bottom support and a descending resistance line, indicating potential for a breakout.
Entry Signal: Look for a breakout above the descending resistance line, estimated at around $0.14, as a signal to enter a trade.
Profit Targets: Target profit zones at $0.17 to $0.19 or the next resistance area between $0.21 to $0.23.
Risk Management: Set a stop-loss order just below $0.12 to manage potential downside risk.
📈 Trading Strategy:
Entry: Initiate a long position upon confirmation of a breakout above the descending resistance line, aiming for a sustainable move.
Targets: Take profits at predetermined resistance levels of $0.17 to $0.19 or $0.21 to $0.23.
Risk Control: Implement a stop-loss strategy to protect against adverse price movements and minimize potential losses.
🚨 Note: Stay vigilant for the breakout signal and ensure to manage risk effectively throughout the trade! #COTI #TradingPlan #CryptoAnalysis 🌟📊

COTI ANALYSIS (1D)After the bearish diametric, the price has entered a bullish pattern.
This bullish pattern can have 3 or more waves. Now it looks like the price is inside the B/X wave.
On the green range, which is the best demand for completing B/X, you can look for buy/long positions.
Closing a daily candle below the invalidation level will violate the analysis.
For risk management, please don't forget stop loss and capital management
When we reach the first target, save some profit and then change the stop to entry
Comment if you have any questions
Thank You

Coti Coti has done mss and now I'm going to build Long opportunities at Marked entries. I think this will be very perfect trade setup as per my setup. What are your thoughts?

COTI/USDT Shows a good sign for bouncing and back to upward!💎 The recent market dynamics surrounding #COTI have indeed been quite notable. Currently, COTI is positioned on the support area, and there are indications of bullish momentum with a rejection bullish candle.
💎 This suggests potential for a bounce from the support and a resumption of upward movement. There's a possibility that COTI will continue its upward trajectory, potentially reaching our target at the strong resistance area.
💎 However, if COTI fails to maintain the support or execute a successful bounce, it could signify a loss of momentum. In such a scenario, a breakdown below the support level may occur. If this happens, it would confirm a return to bearish sentiment and could lead to continued downward movement.
💎 Therefore, it's crucial to monitor COTI's behavior around the support area closely to assess whether the bullish momentum will be sustained or if a bearish trend reversal is imminent.
MyCryptoParadise
iFeel the success🌴

COTI - Zone UPHello. Today we are looking at COTI cryptocurrencies. Recently we saw a strong upward move, which was caused by fundamental information. At this point, we can see a clear corrective structure with a clear entry zone. The entry condition is the breakout of the low of wave A and low RSI on the H4-D1 intervals. We should look for a candle formation in the zone. The target for this trade will be a new top. This is a SPOT and leverage zone.

I Cannot Short This !!!Hi.
COINEX:COTIUSDT
Today, I want to analyze COTI for you in a 12H time frame so that we can have a SHORT-term view of COTI regarding the technical analysis. (Please ✌️respectfully✌️share if you have a different opinion from me or other analysts).
➡️COTI has done a Impressive Movement recently but the odds of another bullish Movement is Pretty high because the pattern which COTI is in, Is a Bullish wedge Pattern! Since The break out has not happened, there is no confirmation of a Bullish Movement But If It happens....
✅ Due to the Ascending structure of the chart...
🟢 COTI has been Bullish Recently!
🟢 The odds of another Bullish Movement is High!
🟢 Bullish wedge is Visible on The chart!
🟢 No break out yet!
🟢 Bullish Divergence
Stay awesome my friends.
_ _ _ _ _ _ _ _ _ _ _ _ _ _ _ _ _ _ _ _ _ _ _ _ _ _ _ _ _ _ _ _ _
✅Thank you, and for more ideas, hit ❤️Like❤️ and 🌟Follow🌟!
⚠️Things can change...
The markets are always changing and even with all these signals, the market changes tend to be strong and fast!!

#COTI/USDT#COTI
The price moves in a bearish channel on a 4-hour frame.
The price moves within it and adheres to it to a large extent. We have higher stability, moving average 100.
We have a downtrend on the RSI indicator that supports the rise and is about to break higher
Entry price is 0.1718
The first target is 0.1800
The second goal is 0.1985
the third goal is 0.2114

#COTI/USDT#COTI
The price is moving in a bearish channel on a 4-hour frame and we have a support area in green at the 0.1700 level.
We have a higher stability moving average of 100
We have a good bounce being set up from the lower border of the channel
The RSI indicator has a downtrend that is about to break higher
Entry price is 0.200
The first target is 0.2200
The second target is 0.2682
The third goal is 0.3338

COTI/USDT Showing a bouncing, bullish momentum for back to up?💎 Paradisers, #COTI has recently exhibited notable market dynamics, particularly with a bounce from the support area.
💎 Historically, when COTI hits this support level, it tends to sustain and rebound, suggesting a similar pattern may unfold now. There's potential for the price to test the strong resistance area if this pattern continues.
💎 However, a breakdown below the support area could signify a bearish trend, leading to further downward movement towards the $0.11 support level.
💎 It's crucial for COTI to bounce from the support and reclaim the price above it. Failure to do so could result in continued downward movement.
MyCryptoParadise
iFeel the success🌴

📈 COTI Trade Setup 📉📊 Analysis:
Market Sentiment: Recent support finding and upward movement suggest a potential reversal in the market.
Technical Position: COTI is currently resting on a support level, indicating a favorable entry opportunity for a long trade.
Laddering Strategy: Employ laddering technique to optimize entry and manage volatility.
Entry Range: Consider entering the trade between $0.17 - $0.19, aligning with the current support level.
Profit Targets: Look for profit-taking opportunities at resistance zones around $0.25 - $0.27 or $0.31 - $0.34.
Risk Management: Implement a stop loss just below $0.16 to limit potential losses in case of adverse price movements.
💡 Note: Stay attentive to any market developments and adjust your strategy accordingly. Keep an eye on overall market sentiment and BTC's movement, as they may impact COTI's price action.
