COTTON Weekly Chart Low risk LONG Good support in the 77's on multiple time frames just tested middle bollie on the Weekly
Cotton

COTTON (COTUSD)After a thorough analysis, numerous bat patterns were discovered in the historic data of cotton. It is anticipated that a bearish bat pattern is about to complete, currently in the CD leg. The entry point is expected to occur at 0.7740. Stop loss is 0.7793, 113% extension of XA. Profit targets will be at 0.7581 and 0.7484 which are the 38.2% and 61.8% retracements of AD.

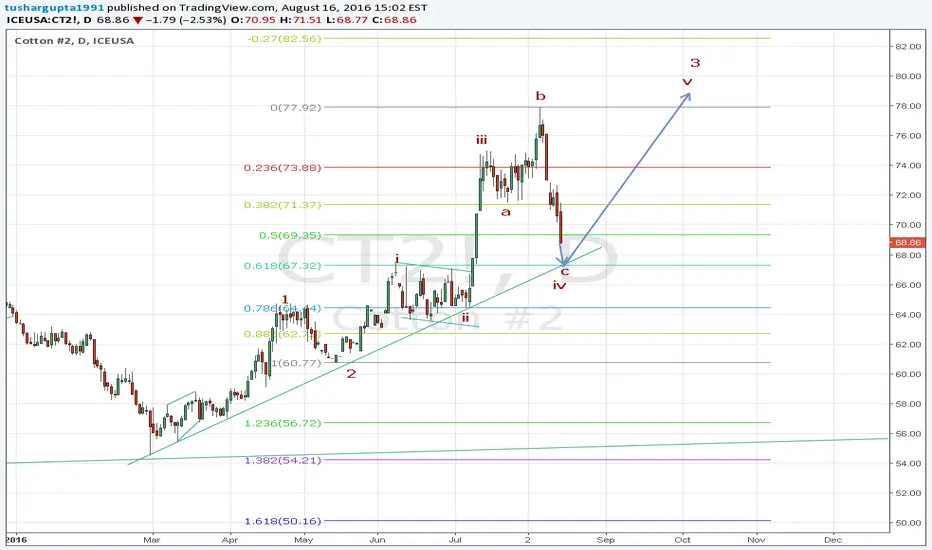
CT overbought. Looking for sideways to take a breatherTechnically overbought. New highs made with declining volume. Not an indicator for continued strength. Overall uptrend is intact, but we are near upper end of trend channel. On top of that market is overbought based on BB, RSI and Stochastik.
Targets:
1. Middle bollinger Band
2.Upsloping red shorter term trendline
3. Longer term red trend line, and 100 day MA and lower BB (all similar area). --> big support
4. 200 day MA (yellow)


CT1! @ daily @ closed lower last 2 trading days, day by dayThis is only a trading capability - no recommendation !!!
Buying/Selling or even only watching is always your own responsibility ...
.zip (with PDF`s) @ my Google Drive
Closings Bearish (32 Commodities)
drive.google.com
Best regards :)
Aaron

cotton might give a chanceCotton price is now squeezed within a small wedge and short bollinger band width indicating price is ready for a breakout. Of course we do not know the way of the breakout yet but price above 200dma is a very basic indication that daily trend is still up. saying that we will look for breakout and take position accordingly.

Cotton CyclesEach red or green arrow indicates whether cotton prices have been in an up or downtrend. Results have been incredibly consistent since the 18th century.


Potential Long thesis on Cotton1. Pin bar (16/08/2016)
2. Key support area of $45.00
3. Uptrend line support being tested
4. Trend
5. Breakout zone
6. Pullback
7. Fib 0.618 (measured form may low's to August Highs

Bullish on cottonCotton seems to have formed an Expanded Flat in Wave 4. It could reverse any moment now.
IF it makes it to the trendline, then could reverse from there too.

Close to short on cottonLooking for cotton to finish it's five waves up to 65.61 to short the correction. Correction should take us to between 58.75 to 61.37.

Long cotton to over 66, then short....Looking for cotton to go ove 65.94 to short it. MACD showing negative divergence so in the next days should spike up ove 66. Looking to short on that spike up.

RunningAlpha Upgrades Commodity Markets Update to Priority ListRunningAlpha dot com Capital Markets Intelligence High Priority Update for Monday, May 2nd, 2016
Although $39 and $36.50 remains baseline intermediate to long-term support for Light Crude Oil ( in reference to June Contract Pricing ), the recent advance upwards has opened the door for a further short covering rally upwards to $62 to $65, and perhaps $74 to $76 levels if on a spike. Bullish window for buying on dips extends into at least June period -- this also applies to Brent Crude. Russian Stock Market ( $RSX ) looks bullish during this period. Oil and Gas Drilling stocks will likely continue higher on balance -- particularly a core position in stocks like $PBR.A would be sensible, which should also benefit from a continued bullish run in Brazilian Equities ( which I expect Brazilian equities should trend higher into the summer, and again later in the fall to close out the year much higher ). Among many other equities in Latin America, $ARCO and $KOF also have a strong bullish bias with sentiment conviction windows extending into foreseeable future.
Other Commodity Markets showing very significant sentiment strength going forward are in the Agricultural complex -- Soybean, particularly Soybean Meal $SOYB, Rice, Corn $CORN, Cotton $BAL and Coffee ( $JO is ETF -- when above $18.02 and especially when trading above above $19.00, then $27 is interim target ), and even wheat to some degree. Equities that would benefit from a rise in these commodity markets should have a tail-wind. Silver and Gold stocks, which RunningAlpha.com has been bullish on for a few months now, still shows signs of strength on pullbacks. Sourced from premium sentiment conviction list on RunningAlpha dot com


Cotton Ascending Triangle BreakoutCotton Ascending Triangle Breakout
Long on 40-50% pullback from breakout line

Cotton - Long term setupShort is much more possible on this commodity according to channel and bears on the market.
On downtrend we have 2 more support areas. But always market decides the way we just follow it :)

Long CottonLong cotton. Trendline setup. It this does not hold here - I will be looking for short position on a re-test under the trendine.

Cotton : New Bearish Impulse Is Underway Correction seems to be completed on the Daily graph of Cotton, because price made a sharp action to the downside resulting in three impulsive red waves. Currently price is trading in red wave (3) that could reach levels between 57.40 - 58.20.
Link to our previous charts:
www.ew-forecast.com

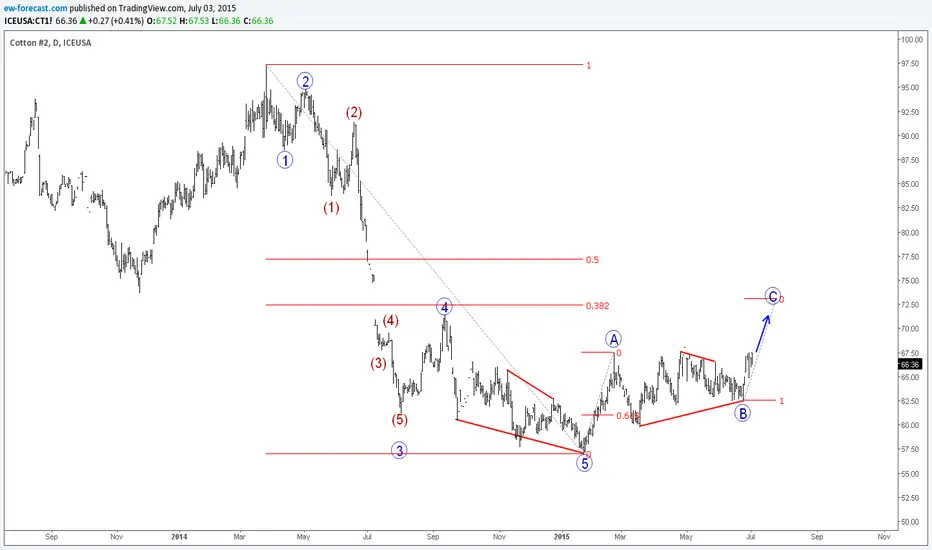
Cotton Update II: Cotton Could Move Higher In Days AheadAs wee see correction in blue wave B seems to be finished, as price moved sharply to the upside. That said new leg up in blue wave C is expected to unfold in weeks ahead. The price may move towards 72 - 73 area.
www.ew-forecast.com
COTTON : More Upside Within Big Corrective RallyCotton is trading in a correction after a 5 wave structure to the downside. The correction may reach the fibo level of 0.382, at blue wave 4 termination point. That said price may reach higher levels to around 72 - 73.
www.ew-forecast.com

CT#11 still bearish long term - possible reversal aheadHere is my contribution to the nice ichimoku analysis done by Kumowizard and posted at www.tradingview.com
The wave count on the weekly chart reinforces the idea that bears will keep control on the mid/long-term. At this point in time it is pretty safe to assume that intermediate-3 is consolidated retracing the full 2.618 ratio and suggesting this would be an extended 3. Wave 4 retraces nicely at 0.236 times wave 3 and the AWE oscillator indicates that a 3-5 divergence is possible. Wave 5, when 3 is extended, can develop between 1 times wave 1 (equality to wave 1), 0.618 times wave 1 or (less likely in this case) 1.618 times wave 1.
On the daily chart, a couple of alternate count is possible; however, my preferred count would the one shown in orange with minor wave 3 under development.
Like Kumowizard mention in his analysis, an upward (most likely brief) movement could be possible as part of lesser degree wave count (not shown on chart above) suggesting a corrective wave 4 would be under way.
Takeaways: If the ongoing Intermediate 5 and Minor 3 materialize, it could lead us into a more consistent upward move/correction, but then again, alternate counts are possible therefore feel free to contribute.

Cotton - Heading down again.New setup in Cotton formed from a DP level that has a confluence with an ABC correction. This is one of the clearest Elliot wave patterns to play. The setup is giving a Risk Reward ratio at 2.5 at the quite conservative typical Wave 3 target. As an extra odds enhancer it was an VSA spike in the volume moving the price towards the entry.Target is in front of the swing low from 20 november. Last setup with this technical analyses was from a Decision Point that was at same level as a Elliot Wave 5 level and gave a very healty reward in R. In all my technical trading I like to stack my odds together at the entry levels with preferably more than one technical structure.
