⚡️Strifor || USDCHF-11/01/2024Preferred direction: BUY
Comment: The dollar is still being considered for sale. There were low expectations that we would see a strengthening of the US currency before the publication of inflation data in the US. But nevertheless, the buy-priority remains in USD .
USDCHF forms a clear accumulation, which is filled with market sales. And this means a potential resource for growth. Technically, we continue to accumulate before reaching the level of 0.85696 , which also says more about an impending upward breakout of this resistance.
The scenarios are highlighted on the chart. The first is more likely, but the second may be realized just at the time of the publication of inflation data. That is, in the second case, there will be a preliminary false breakdown downward and then a growth above the level of 0.85696.
Thank you for like and share your views!
CPI

⚡️Strifor || NZDUSD-11/01/2024Preferred direction: SELL
Comment: The New Zealand dollar is also expected to fall. Here, the situation is exactly the same as with AUDUSD. An accumulation formed at the level of 0.62359 , filled with purchases (long-orders). The publication of inflation data in the US is expected, against the background of which a downward impulse may happen.
Also, due to the data, at the time of publication there may be increased volatility, we do not exclude a potential false breakout of the upper limit of accumulation (scenario №2), after which we wait for the target price at the level of 0.61263.
Thank you for like and share your views!

Gold plunges as investors await fresh cues about Fed rate cutsGold price has been hit hard amid uncertainty over US Retail Sales and Industrial Production data.
A strong US Retail Sales data would provide more room for the Fed to maintain higher interest rates.
•Further escalation in Middle East tensions could bring some revival in the gold price.
Gold price (XAU/USD) witnesses a sell-off after failing to reclaim the weekly high above $2,060. The precious metal drops as investors reconsider the timeframe in which the Federal Reserve (Fed) may reduce interest rates. This comes after the release of the sticky Consumer Price Index (CPI) report for December, as well as hawkish comments from European Central Bank (ECB) officials recalibrating broader market expectations.
While markets continue to lean towards a rate cut decision in March, policymakers are in no hurry to endorse a dovish stance on interest rates. The consumer price inflation in the United States economy is almost double the required rate of 2%, labor demand is steady and the chances of a recession are low despite interest rates remaining in the range of 5.25-5.50%. This would allow Fed policymakers to maintain a restrictive monetary policy stance for the time being.
Going forward, monthly US Retail Sales, the Industrial Production data and the Fed's Beige Book are expected to provide fresh cues about the interest rate outlook.
Daily Digest Market Movers: Gold price falls sharply as US Dollar, yields recover
Gold price corrects to near the crucial support of $2,040 as the US Dollar Index (DXY) has recovered sharply ahead of crucial United States economic data for December.
A strong run-up in the precious metal that was propelled by firm bets in favor of early rate cuts by the Federal Reserve and deepening Middle East tensions, has stalled for now.
• As per the CME Fedwatch tool, chances in favor of an interest rate cut in March have eased nominally to 66% against 70% recorded earlier.
A gradual decline has come as investors are reconsidering strong optimism for Fed starting the rate-cut cycle from March after getting mixed cues from stubbornly higher headline consumer price inflation and softer factory gate price data.
Investors would get more cues about when the Fed could plan rate cuts after the release of the monthly US Retail Sales and Industrial Producer data, which are due to be released on Wednesday.
• Retail Sales are expected to have grown at a higher pace of 0.4% against 0.3% increase in November. Consumer spending excluding automobiles is estimated to have grown at a steady pace of 0.2%.
• The Industrial Production data is seen stagnant against 0.2% growth in November on a monthly basis.
Upbeat economic data would comfort Fed policymakers for maintaining a restrictive monetary policy stance while a soft report will firm the case of rate cuts in March.
• Before that, commentary from Fed Governor Christopher Waller will be keenly watched by market participants. Investors are eager to know how the Fed is considering the timeframe for the rate-cut cycle after the release of sticky consumer price inflation data.
• The appeal for the gold price has not been impacted on a broader basis as crises in the Middle East region have deepened after the airstrikes from the US and the United Kingdom.
Iran-backed Houthi rebels have threatened to retaliate for attacking groups in Yemen, which will keep risk sentiment on its toes.
• The US Dollar Index has broken to a new high slightly above 103.00 as investors hope that other central banks will also start reducing interest rates earlier than previously projected. Meanwhile, the 10-year US Treasury yield has rebounded swiftly above 4.0%.
Technical Analysis: Gold price corrects to near 20-day EMA
Gold price has faced a sharp sell-off after failing to recapture the weekly high of $2,062. The precious metal has dropped to near $2,040 and is expected to remain on tenterhooks before getting fresh cues about the timing of rate cuts from the Fed. The yellow metal has surrendered entire gains generated on Monday and has corrected to near the 20-day Exponential Moving Average (EMA), which trades around $2,039.
More downside could appear in the gold price if it fails to defend the January 3 low of $2,030, which will expose it towards the psychological support of $2,000.

Core and Headline Producer Price Index (PPI) Release Core and Headline PPI (Dec 2023 figures)
U.S. Headline PPI
Prev: 0.8% / Exp: 1.3%
Rep: 1.0% ✅ Lower than expected ✅
U.S. Core PPI (excludes food and energy)
Prev: 2.0% / Exp: 1.9%
Rep: 1.8% ✅ Lower Than Expected✅
What is PPI and why is it important?
Producer Price Index is a crucial economic indicator that provides valuable information about inflationary pressures at the producer level. By tracking changes in producer prices over time, it provides insights into inflation trends before they manifest in consumer prices.
Difference between Core and Headline PPI
The Core PPI aims to provide a more stable measure of underlying inflation, while the headline index reflects all price changes, including those driven by more volatile components such as food an energy. You can see from the chart that Headline PPI in red is the swings more widely up and down due to the inclusion of these volatile components (food and energy).
✅ LOWER THAN EXPECTED PPI TODAY✅
Core and Headline PPI came in lower than expected this month and as you can see we are reaching down into the historically more moderate zone between 3% and -1.5%. This bodes will for inflationary pressures in general and may be an early indicator of lower Core and Headline inflation figures (for CPI) in the coming months.
PUKA

GOLD|Important supply and demand areasHello friends, I hope you are doing well.
We have the gold chart in 1 hour.Currently, gold is fluctuating in a trending range area and we have the top and bottom of the trending range to enter trading positions.
CPI data will be released today, if we have data that is in favor of gold, that is, the US inflation has decreased, this means that it will harm the dollar index and gold can move upwards.
We should know that apart from the top of the trending range, which is a resistance, we have the next resistance in the area of (2046-2044) and after the resistance that is the base of the falling movement, it is around (2066-2064).
On the other hand, if inflation is published more than expected, it will benefit the dollar index and can create selling pressure on gold.
The area that currently maintains the price is the area (2016-2019). If this area is broken, the next support is the price range (2004-2008) and then the price range (1990-1995).
If the price reaches these areas, we can enter trading positions with confirmation

⚡️Strifor || SILVER-US PPI‼️Preferred direction: SELL
Comment: Recent events in the Middle East have made markets nervous. In turn, this has traditionally generated demand for metals. However, so far the situation is not particularly serious, since Yemen is a constant point of hostilities. There are unlikely to be any strong purchases in metals until the end of today's trading day. But after the weekend, it is better not to postpone deals of this kind to the next week.
Technically and considering volumes, shorts are still being looked for. We have two scenarios ready for the US PPI data. We consider the target for the fall to be at the level of 22.00.
Thank you for like and share your views!

⚡️Strifor || GOLD-US CPI‼️Preferred direction: SELL
Comment: For Gold , we also consider two scenarios simultaneously. Since, against the backdrop of the publication of inflation data, it is quite logical to expect increased volatility, and false movements are not excluded. Our main direction is to sell and consider a fall to the 2000 level, with the potential for further declines.
You can consider adding a short position at the level of 2060 . Stop loss is placed beyond the level of 2090 . The final fall can be expected down to the level of 1960 and 1950 .
Thank you for like and share your views!

⚡️Strifor || GBPUSD-US CPI‼️Preferred direction: SELL
Comment: As expected, due to the high correlation between the British pound and the Euro , the situation for these currency pairs before US inflation is absolutely the same. For this pair, scenario №1 is considered worked out. But scenario №2 does not lose its relevance.
Therefore, scenario №2 is very relevant before the publication of data from the United States . We set the downside target at 1.26000. We place the stop loss at 1.28500 , closer to 1.29000. If something happens, within the specified stop loss ranges, you can consider adding a position or re-entering the sell.
Thank you for like and share your views!

⚡️Strifor || EURUSD-US CPI‼️Preferred direction: SELL
Comment: Ahead of the inflation data , the situation for the Euro did not change. The current sluggish recovery is due to a surge in market sales that were missed by limit buyers. This does not mean that we will now grow rapidly. Most likely, a major player has not allowed the price to move, as the impulse is delayed until the US inflation publication, which will take place today.
Two short scenarios are now autal, that is, two transactions can be active at once with a target at the level of 1.08000 . Stop loss should be placed slightly above the level of 1.11000.
Thank you for like and share your views!

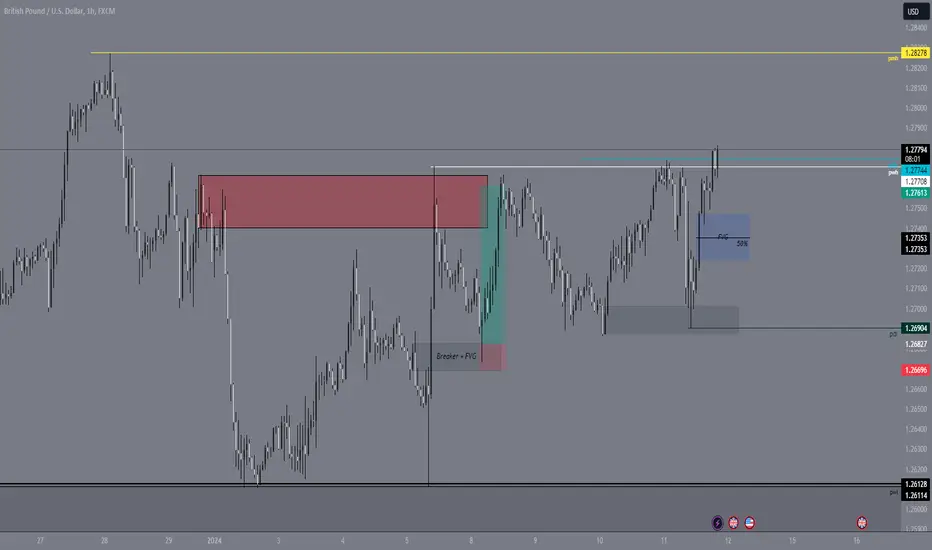
Short GBPUSD on Strong USD SentimentThe Federal Reserve's unwavering commitment to a restrictive monetary policy aimed at restoring economic balance and curbing inflation, recent market sentiment strongly favors the US dollar. Against this backdrop, the GBPUSD pair finds itself in a precarious position, hovering around the pivotal point of 1.27815. The heightened expectations of the Fed continuing its policy firming, coupled with concerns over inflation, suggest a potential downside for GBPUSD. Technical analysis aligns with this sentiment, indicating a possible bearish trajectory towards the target level of 1.26181. As we delve into the intricacies of this forecast, it becomes evident that the dynamics of strong USD sentiment and the Federal Reserve's steadfast approach set the stage for a compelling trading opportunity.
Technical Analysis:
Current GBPUSD level: 1.27815 (around pivot point)
Technical bias: Bearish 🐻
Target level: 1.26181
Reasoning:
Strong USD Sentiment: The recent statements from the Federal Reserve suggest a commitment to a restrictive monetary policy stance to achieve their inflation target. This has led to a boost in market sentiment favoring the USD, as evidenced by recent economic data indicating inflationary pressures.
Fed's Policy Actions: The Federal Reserve has implemented a restrictive policy over the past two years to achieve balance between demand and supply and restore price stability. The commitment to maintaining this stance until inflation reaches the 2 percent target suggests a continued strong sentiment for the USD.
Inflation Concerns: The recent inflation data, with the consumer price index increasing by 3.4% in the year through December, highlights concerns about inflationary pressures. This could lead to a stronger push from the Fed to maintain a restrictive policy, adding to the bullish sentiment for the USD.
Technical Levels: GBPUSD is currently around the pivot point area (1.27815), indicating a potential turning point. A break below this level could signal further downside movement. The target level of 1.26181 aligns with the bearish sentiment and provides a reasonable downside objective.
Risk Management:
Stop-loss can be set above Pivot Point or a key resistance level to manage potential losses.
Monitor economic releases and Fed statements for any changes in sentiment that could impact the trade.
Disclaimer:
The outlined trading idea is not a guarantee of future results, and past performance is not indicative of future performance. Always use risk management strategies such as setting stop-loss orders to mitigate potential losses. It is essential to stay updated on economic releases, central bank statements, and any other relevant news that might impact currency movements.
Happy Trading! 📉🐻

XAUUSD BuyBuying Gold due to the failed close below 2016. I predicted 2012 last week, but to see this I'd anticipate good confirmation. This has not happened yet, CPI has dropped gold over 150 pips, now im expecting a clear push back to 2025+ area.
Ive entered at 2016.54, targeting 2029.54 and my stop is set at 2013.54. Gives me a 1:4.33 R/R 1%Risk
Entered at the low end of a 4Hr OB, which I'd like price to close above.
Not to much more analysis here, kept it simple, still using @nephew_sam_ FVG indictor so testing this on my funded account.

Post CPI Review - DXYAs you can see price has not broken out of this range on DXY. We have taken out equal highs, which means I am favoring lower prices if we can see a strong close below sell side. Otherwise if price does not break below I anticipate it staying in this range until next week. Trade safe traders!!

Post CPI Review - GBPUSDDuring pre-London, we saw price take out previous weekly highs. As NY price action played on we saw price retest those and go bearish during news release. Retested a demand zone and took out highs again during Asia. I anticipate GBPUSD to continue higher toward previous monthly highs.
Post CPI Review - XAUUSDWhen CPI released we saw a run on highs. Price came back to an order block on the 1hr (2045). After we saw that run, 2017 was the target for liquidity. As expected we'd see a run on lows now I am bullish toward 2062. Need to see price breakout and create a new high, we'll see how London plays out.

headline CPI inflation indicate lower gold pricesHigher than previous headline CPI inflation indicate lower gold prices and higher USD
the Nasdaq future and BTC should be expected to drop for the coming weeks and/or rest of the month.

Gold Under the weight of a hot CPIIn tomorrow's trading session, the spotlight is on XAUUSD as we consider a selling opportunity around the 2043 zone. To form a nuanced view, it's imperative to juxtapose the recent Consumer Price Index (CPI) data with preceding figures. The CPI figures from today—3.4% actual, 3.2% forecast, and 3.1% previous—demonstrate a slight uptick, indicating inflationary pressures persisting in the economy. Comparing this to the preceding months, we observe a gradual decline from 3.7% in October to 3.2% in August. Despite today's uptick, the overall trend signals a moderation in inflation.
Now, let's delve into the implications. The unexpected nature of today's CPI data, surpassing both expectations and the previous figure, introduces an element of surprise. Markets are sensitive to such surprises, particularly when it comes to inflation, as they can influence monetary policy decisions. A stronger-than-expected CPI could lead to speculations of a more hawkish stance from central banks, notably the Federal Reserve. Traders may anticipate a potential interest rate hike, a move that tends to strengthen the currency. Consequently, we can anticipate a favorable environment for the US dollar in tomorrow's session.
Adding a technical layer to our analysis, Gold is currently navigating a downtrend, with a correction phase approaching the 2043 support and resistance area. The technical outlook aligns with the fundamental expectation of a potentially stronger US dollar. Gold and the US dollar often exhibit a negative correlation, where a stronger dollar tends to put downward pressure on gold prices. Traders should bear this in mind when considering positions in XAUUSD.
In conclusion, the intersection of fundamental and technical factors paints a compelling narrative for tomorrow's trading session. The unexpected strength in CPI data introduces an element of uncertainty, and traders should remain vigilant to potential shifts in market sentiment. The technical setup in XAUUSD aligns with the fundamental expectation of a stronger dollar, emphasizing the importance of a holistic approach in navigating the markets.
Trade wisely,
Joe

EURUSD Breakout and Potential retrace with today's CPIIn today's trading session, our attention is focused on EURUSD, with a keen eye on a potential selling opportunity around the 1.09700 zone. After breaking out of its uptrend, the pair is currently in a correction phase, edging closer to the retrace area at the 1.09700 support and resistance zone.
Adding a fundamental layer to our analysis, the recent Consumer Price Index (CPI) data could play a pivotal role. The US dollar's strength, influenced by economic indicators such as CPI, may impact the overall direction of EURUSD. Traders should keep a close watch on the evolving market dynamics, especially considering the potential implications of USD strength on this currency pair.
As always, trade safe.
Joe

Core and Headline CPI RELEASED (Dec 2023 figures)Core and Headline CPI (Dec 2023 figures)
U.S. Headline CPI
Prev: 3.1%
Exp: 3.2%
Rep: 3.4% 🚨 HIGHER THAN EXPECTED 🚨
U.S. Core CPI
Prev: 4.0%
Exp: 3.8%
Rep: 3.9% 🚨 HIGHER THAN EXPECTED - but still fell
from 4% to 3.9%✅
CORE CPI FALLS BELOW 4% FOR THE FIRST TIME SINCE MAY 2021
We have a long way to go before we reach the Fed Target of 2%.
Additional info previously shared:
Core vs Headline (the difference)
You can clearly see how Core CPI is less volatile than Headline CPI on the chart. Core CPI removes the volatile food and energy expenditures to provide the underlying inflation trend. Food and Energy is included in the Headline inflation which as you can see from the chart is much more volatile and changes direction quicker than core inflation. Its almost like an oscillator around the core inflation line.
The Feds 2% Target
It is clear that we are not at the Federal Reserve’s target inflation rate of 2% on both fronts (purple line). It is critical to understand that we are still not at or below the target 2% level regardless of the FOMC’s determination of a likely hold on interest rates and reductions to interest rates in 2024. Lets see can the target be met first.
You can see that since 2002 Core CPI has fluctuated one standard deviation above and below the 2% inflation level between 1% and 3%. It is clear that we are not back into this standardised zone between 1 – 3%.

GBPUSD - SELL CPIGood morning, everyone! Today, we're going to dive into an intriguing aspect of the forex market, focusing on how the US Consumer Price Index (CPI) impacts the GBP/USD currency pair. Understanding this relationship is crucial for traders and investors who navigate the complexities of forex markets.
Understanding US CPI
First, let's understand what the US CPI is. The Consumer Price Index is a vital economic indicator in the United States, measuring the average change over time in the prices paid by consumers for a basket of goods and services. It's a key measure of inflation in the US economy.
US CPI's Impact on Currency
Now, how does the US CPI affect the GBP/USD pair? When the US CPI data is released, it can have a significant impact on the value of the US Dollar. A higher-than-expected CPI suggests rising inflation in the US, which could lead the Federal Reserve to increase interest rates. Higher interest rates typically strengthen the Dollar, as they attract investors looking for higher returns on their investments in US assets.
In contrast, if the US CPI comes in lower than expected, indicating lower inflation, it might lead to a weakening of the Dollar. This is because lower inflation could signal a delay in interest rate hikes by the Federal Reserve.
Technical Analysis: Resistance Levels
In addition to the CPI, technical analysis plays a crucial role in forex trading. For GBP/USD, multiple rejections at resistance levels can be a key indicator. Resistance levels are price points at which a currency pair has difficulty rising above. If GBP/USD has faced multiple rejections at certain resistance levels, it indicates a strong selling pressure at those levels.
Combining CPI and Technical Analysis
When we combine the insights from the US CPI data with technical analysis, we get a more comprehensive view. For instance, if the US CPI is higher than expected and GBP/USD is experiencing rejections at resistance levels, it could signal a potential drop in the pair. This is because a strong US Dollar (due to high CPI) and technical selling pressure at resistance levels can jointly push GBP/USD lower.

GBPUSD : Reversal trading cpiHello hello reversal occur happening in 7:00 p.m.
CPI unemployment rate core CPI CPI


Gold Setup H1 Time Frame | CPI Data NewsGold Setup H1 Time Frame | CPI Data News
Hey Traders ❗️
Welcome back hope you're doing well
This is our 5 analysis on Gold Setup
These idea not based on sell or buy
Its based on #Levels and prediction
On this Setup we catched more then 700 #pips
As you guys seem #Gold currnet point at 2033.65
We draw the two circles at 2040 and draw the line at 2047.00
#CPI fundamental high news impact might be tried to break these resistance at 2040-2047 🔵
Overall we are on #Bearish
Although gold overall view is at 2020-2019 then 2005 ❗️
So enjoy the Gold H1 setup with us 🙌
Cheers....

A clear direction of EURUSD in January. 1. The price was trapped inside an Oder block shaded yellow but also notice how it was respecting the IFVG which then acts as support.
2. The price is not likely gonna break out the OB and IFVG areas.
3. My bias will depend on lower timeframes but I'm only for buys at this moment.
4. Today is CPI and the dollar is more likely to weaken based on my analysis
Thoughts?
