FXI - iShares China Large-Cap ETF... FXI stock is a strong buy due to China's rapid economic growth, diverse portfolio of leading companies, and potential for high returns. Investing in FXI offers exposure to China's expanding market.
9988.HK
Alibaba Group Holding Limited 9.72%
0700.HK
Tencent Holdings Limited 8.73%
3690.HK
Meituan 8.09%
00939
00939 7.08%
01398
01398 4.74%
03988
03988 4.26%
9999.HK
NetEase, Inc. 4.00%
1810.HK
Xiaomi Corporation 3.77%
9618.HK
JD.com, Inc. 3.73%
01211
01211 3.51%
FXI stock is a strong buy because while the US and Europe have experienced an incredible bull run, China's market hasn't seen the same gains. This offers a unique opportunity for potential growth and high returns.
CQQQ
CQQQ May 7th TTR UpdateTheTradersRoom is very long #CQQQ from much lower levels and looking to hold this one till at least we see 2-3x gains on it.
We have entered it first days of Feb and very happy with the result.
China is recovering and Im expecting a perfect inversion alignment to QQQ here into the end of the next year.
It was a clear breakout from the downtrend channel last week. If the broken channel gets tested from above, it will be a perfect opportunity to add into our long position.
Stocks - SOHU major bullishIdea for SOHU:
- China is now beginning an easing cycle.
- While rising yields may take the wind out of US tech's sails, there is an opportunity in China tech, if one can stomach the regulation risks.
- Price has formed an immensely bullish setup (C&H/Bull Flag).
GLHF
- DPT
CQQQ going up!AMEX:CQQQ
At 4H, they broke through the 100MA and buried themselves in the additional resistance level = 74.
A local rollback is possible, but after that the growth will continue. Or it will reach 100MA on 1D and the first target and then retest the level 74, unloading local indicators to continue to grow on the rest of the targets. Having also reached the second goal, the chart will break through the resistance of 100MA 1D and change the trend.
Target: 77.25, 80.34, 86.63
Alibaba Breakout + SeasonalityBABA broke out two days ago, with above average intraday volume.
OBV is confirming slight positive trend.
Taking a look at seasonality:
We are entering July, which has been THE best performing month in the past 8 years.
BABA has closed higher than it opened 83% of the time in July, since 2014.
Approximate Potential Target ---> $275
CQQQ Sunny on the Daily, Ugly on the Weekly 80-115 rangeI'm long (and upside down). That said I think the 200SMA at 80 is a bottom worst case, and a new run up over 118 is being pointed at by the daily stoch, rsi, and .786 Fib line
Best of luck. Playing with stop losses to prevent further losses in case the daily loses to the weekly.
Weekly Worry
*NOT FINANCIAL ADVICE - NOT A FINANCIAL ADVISOR*
CQQQ - updateCQQQ is a at a critical support level. Most of the news coming from China on the deadly virus has had an impact on investor sentiment and the ETF has seen a dip from our earlier identified level of potential resistance to a new level of expected support
We can see when we apply the Gann fan, the price has moved beautifully in the range and has tested the resistance lines as seen. I have drawn a nice support line and price seesm to respecting the line
Look out for more action on this piece
Please follow for regular updates
Do share a thumbs up if you like what you read
Cheers
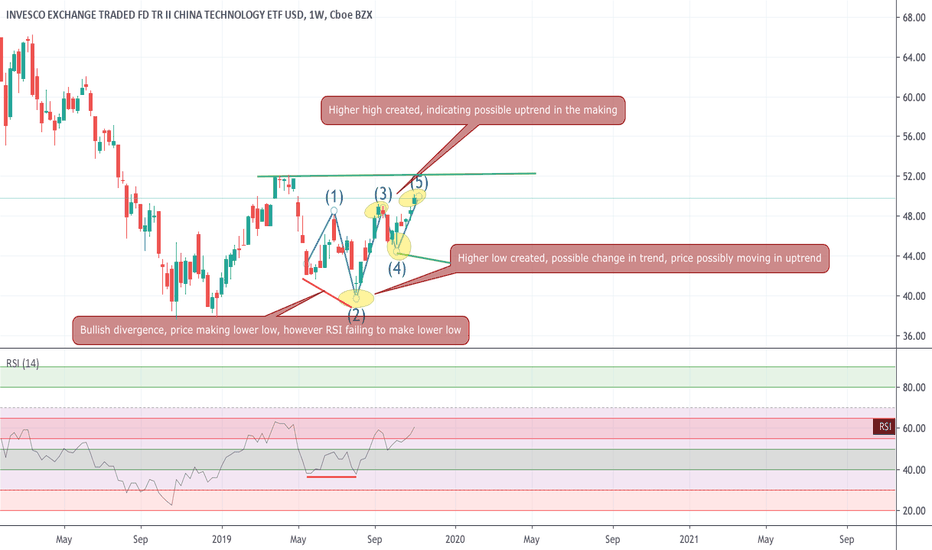
CQQQ, on weekly charts gaining strength - buy set upAs seen on the weekly charts, CQQQ seems to be changing directions. Bullish divergence seen recently as indicated in the chart and price getting into an uptrend, recent week high also broken and price now eying the 52.31 level breakout.
Important to see a retest and look out for price retracing and confirmation of uptrend if price makes a higher low than the most recent previous levels
2 ways to play
1. wait for higher low to be created and if next candle after that formation is positive, go long
2. Incase you want to wait for further confirmation, then wait for 52.31 levels to be breached and then go long
IF you like what you see, please share a thumbs up
Cheers
CN50USD -Ascending triangle formationChina 50 creating a Ascending triangle formation, watch out for divergences going ahead on RSI and price action. Also, ROC over 0 In the positive direction may encourage upwards trend and otherwise in case of sub zero.
Watch out for trends on movements
We are approaching climax and breakout zone and in the Set up stage now . Interestingly, on Daily charts, CQQQ, the technology index for CQQQ tried to make an upward move but came back in zone too. but approaching climax zone. It will nice to see how they all develop going ahead.
Look out for more in this space
If you like what you read, please share a thumbs up !
Cheers
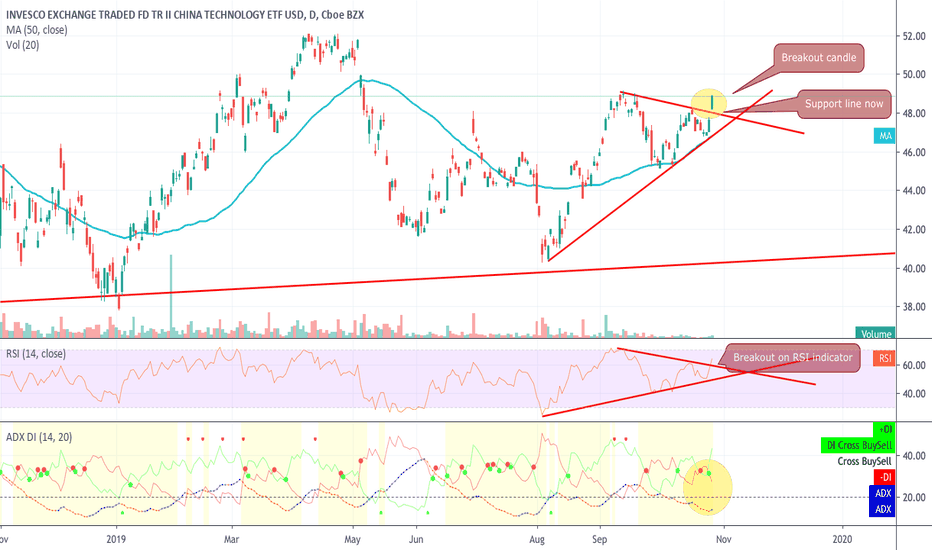
CQQQ - breakout - long with close Stop lossHi Friends , breakout on daily time frame on AMEX:CQQQ .
Look at the breakout with the Green candle peeping out of the triangle formation. RSI and ADX both showing strength (DM crossover the DM- but ADX still weak, but looks like gaining strength.
Watch out for possible retest of the newly found support line ( earlier resistance line) for a possible throwback down to the trend line and then momentum pulling to upwards if the news flow from the trade talks with China remain positive.
If the price renters the triangle then expect the lower support levels of the triangle to be tested fairly soon.
Please note, wait for candle formation (for daily timeframe, wait for close levels to confirm breakouts and also retest levels for finalizing any trade
One could look at entry at this level and place stop loss at 47.50 levels.
LONG TKAT @ $.6954 for Chinese Internet (KWEB) UpsideTechnical Analysis:
1. KWEB (Chinese Internet ETF): Expect a relief bounce here for Chinese Internet stocks ( BABA BIDU JD ) with a Hong Kong ( HKDOW ) & Shanghai ( DJSH ) market rally.
a. Holding 200weekSMA and 50monthSMA support here at $44 with record volume twitter.com
b. Very oversold on weekly timeframe
c. Strong price support at $41.00
d. 4/24/18 gap filled at $43.53
e. Possible reversion to mean: 2018 Chinese Internet % Total Returns (negative) very divergent from US Internet % Total Returns (positive)
2. TKAT (Takung Art Co) showing strong correlation with KWEB with more volatility, conveying a higher beta to Chinese markets. This will result in exceeding KWEB’s % gains on upside price movement.
a. Potential price double bottom $.63-$.68
b. Extremely oversold on weekly/monthly timeframes
c. Daily RSI uptrend from 29 (8/9/18) to 34 (10/11/18)
d. Large accumulation volume on 10/2 and 10/12
e. Testing 10dayEMA @ $.75
Fundamental Analysis: TKAT - Takung Art Company:
1. Takung Art Company fundamentals convey undervaluation and thus provides great risk/reward for China Internet/Software market rally
a. Price to Book = .49
b. Price to Sales = .61
c. Net Current Asset Value = 1.24
d. Cash to Debt = 1.43 – Strong cash position to outlast market downturn
e. Poor 2018Q2 and 2018Q3 earnings coupled with an overall bearish Chinese investor sentiment already priced into stock price
f. Company is expected to resume Listing Revenue (primary revenue stream) end of October – temporarily loss of revenue could be short-lived
g. Company plans to reduce G&A expenses by 10% in 2018Q3
Buying BIDU... Right here, Right now.Shares of BIDU came under pressure because of management changes, but the selloff seems grossly overdone.
Shares are currently sitting on a massive support zone... the 50, 100, and 200 day moving averages are bundled up between $242.39-245.42. Right below those averages is the 61.8% retracement of the previous major swing, further strengthening the support. Additionally, rising trend line support is holding. Should shares decline, there's additional support at $228-230, which is the bottom of a rising channel that's reinforced with the 78.6% retracement of the aforementioned swing.
I'm a buyer right here, right now, and I'll look to add on additional weakness.


