Crab
Silver Crab Vs Forbidden Level The persistent failure of silver buyers to overcome the specified resistance level suggests a prevailing weakness in their purchasing power.
Consequently, market observers anticipate a potential shift in momentum, awaiting the entry of more robust buyers, colloquially referred to as "powerful crab buyers," anticipated to emerge from the harmonic golden level.
This potential influx of new investment could provide the necessary catalyst for a sustained upward trend.
Gold Bullish Crab PatternThe potential surge in gold prices is being closely monitored, particularly as buyers exhibit a notable interest around the significant Fibonacci golden level at a price point of $3220.
This level serves as a crucial indicator for market participants, suggesting that a breakout could lead to substantial upward momentum.
Flag Flutters Precariously: Navigating the Sky of Greed.The Siemens flag, once a symbol of ambition, now hovers in the sky of opportunistic buyers. Previously, it was plummeting toward the ground, but a swarm of butterfly-like buyers, armed with unwavering determination, managed to lift it back up using a sturdy candlestick.
However, in this latest turn of events, the flag now hangs precariously between two vast voids, abandoned by the overconfident grip of greedy crab buyers. Their hold appears too weak to keep the flag aloft, and it seems destined to fall from the lofty height of 214 euros—ironically referred to as the "golden level of the crab." It seems that gravity, much like the harsh reality of the market, inevitably prevails.
Analysis and Implications of AMD Fluctuations & Crab PatternIn the previous idea, we moved along with the buyers and progressed up to a price of $227.
Then, with the crab pattern, the decline in Micro stock began, and this drop is expected to continue down to $52. Afterward, we will once again align with the buyers through the crab pattern.
Silver Bullish Crab PatternThe potential surge in silver prices is being closely monitored, particularly as buyers exhibit a notable interest around the significant Fibonacci golden level at a price point of $32.20.
This level serves as a crucial indicator for market participants, suggesting that a breakout could lead to substantial upward momentum.
I
Dive into the Wild Waves of Gold and Silver!treasure hunters! Ever feel like the gold and silver markets are like surfing big waves?
The fluctuations in precious metal prices are often likened to the contrasting behaviors of wild crabs; gold prices soar upward, akin to a crab climbing, while silver prices plunge into the depths, reminiscent of a crab diving beneath the waves.
Such dynamics illustrate the volatility and unpredictable nature of the commodities market, where various factors can influence the trajectory of these valuable resources.
Understanding these movements is essential for investors aiming to navigate the complexities of financial markets effectively.
Probable Euro Crab Pattern Trend in the Coming Month.In April-May, the Euro index shows intriguing trends, as illustrated in the above chart.
This analysis is grounded in the Harmonic pattern, utilizing Fibonacci tools.
There's a possibility that the EXY CRAB pattern could rise to reach the golden level before potentially descending to a lower golden level.
This insight could be valuable for those tracking currency movements and seeking to understand market dynamics.
Yen's Rate is Crawling Like a Speeding Crab.The rapid advancement of Japanese technology appears to be mirrored in the dynamic movement of the Yen index.
This index has swiftly reached the 1.276 Fibonacci level (71.3), and following a brief consolidation, it is now projected to advance towards the subsequent golden ratio at the 1.618 Fibonacci level (73.1).
This progression potentially allows other currencies the opportunity to converge and catch up with the Yen's performance.
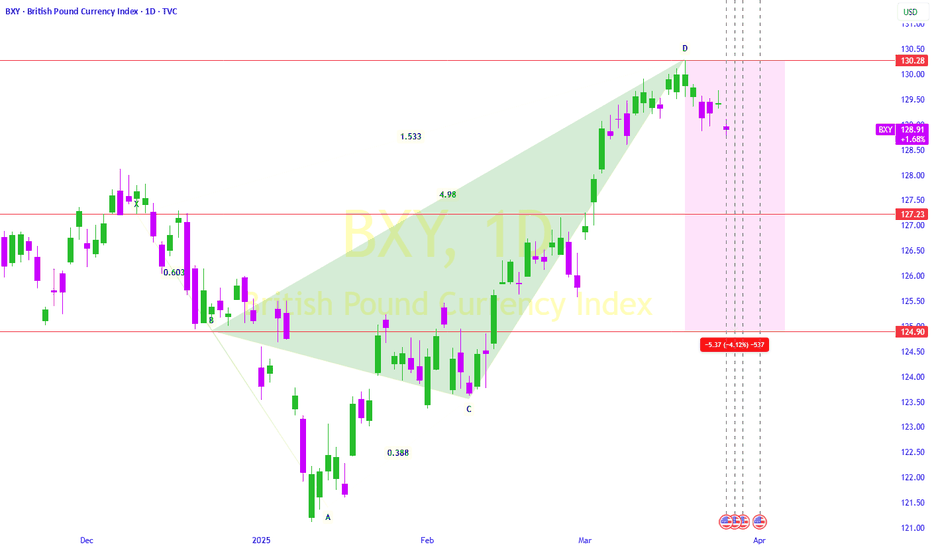
CHF Crab Family Dynamics Alright folks, let's talk Swiss Franc (CHF). You know, that currency that's usually as exciting as watching paint dry? NOT ANYMORE!
Remember when we predicted a zigzaggy dance for the CHF index? Turns out, Mama Crab heard us! She chilled out around 124, causing a delightful little index dip. Thanks, Mama!
But Mama Crab can't do *everything*. She needs reinforcements. Enter: BABY CRAB! We're betting this little crustacean scamp is going to give the index a boost all the way up to 126.
Think of it as a piggyback ride from Baby Crab to the land of profits!
But hold your horses (or crabs, in this case). This isn't a never-ending beach vacation. After that 126 mark? BABY CRAB's going deep sea diving!
Stop guessing and start crab-walking your way to smarter trading decisions!
SEYED.
XNGUSD Bullish Crab Pattern.Attention investors and energy enthusiasts!
The natural gas market is heating up with exciting developments.
We anticipate a significant surge in natural gas prices, projected to rise from $3.65 to $4.35 in three strategic phases based on Crab Harmonic Pattern .
This forecast reflects a robust demand landscape and evolving market dynamics. As the energy sector continues to adapt, seizing this opportunity could position you ahead of the curve.
Stay informed and take action now!
Embrace the potential for growth in natural gas investments.
SEYED.
Copper Rebounding from a 3-month low!Copper is bouncing back with incredible energy after hitting a 3-month low!
Get ready to see it surge towards $4.84!
But hold on tight, because after that, it's time for the "Copper Crab" to unleash a powerful dive, plunging back down into the depths!
Exciting times ahead for copper traders!
SEYED.
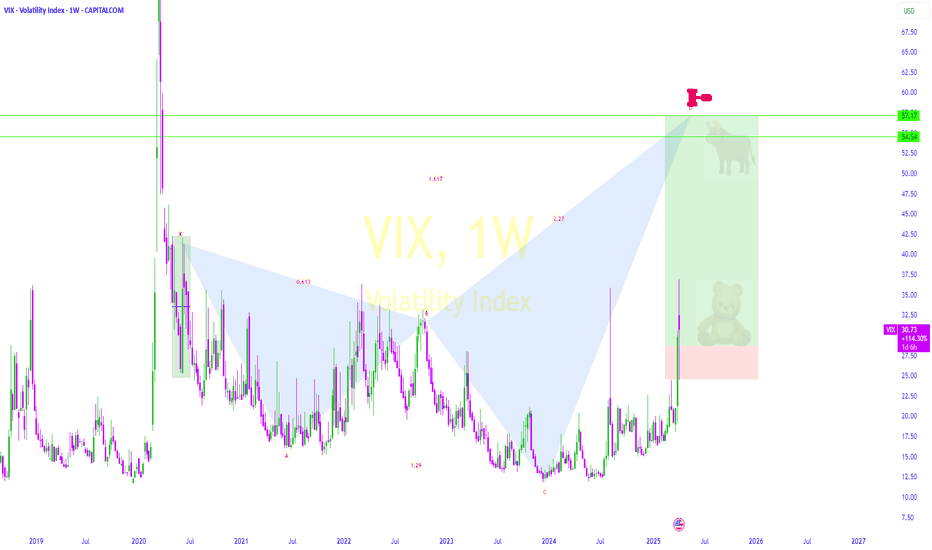
Technical Analysis of VIX Dynamics:As we predicted, the small crab (retail traders) jumped from the ocean depths (high VIX zone) but failed to break the golden resistance at 29 due to panic and stress.
Now the mother crab (institutions) is preparing to surface. If successful, this could crush the VIX and dramatically shift market sentiment - just like we originally envisioned in our crab market theory."
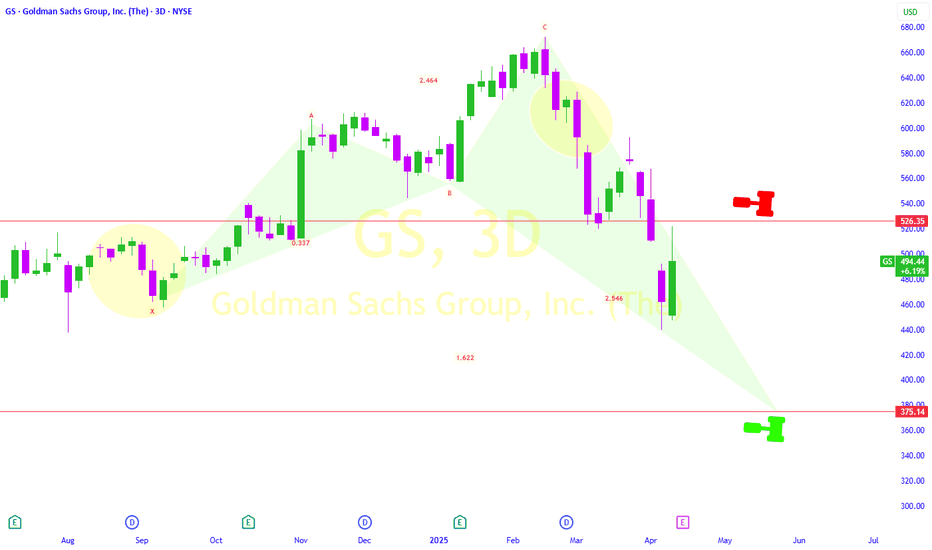
"Trip of Sache Sellers Crab" is still ongoing.Alright folks, let's talk Goldman Sachs.
They're dropping their earnings report tomorrow, which means Wall Street's gonna be buzzing like a caffeinated hive. Are we ready for a bullish breakout? A bearish beatdown? Honestly, your guess is as good as mine.I’m about as fundamentally clueless as a goldfish in a shark tank.
But fear not! (Or fear slightly, depending on your risk tolerance).
According to our resident "technically proficient" (and slightly cryptic) fortune teller Crab , the "Trip of Sache Sellers Crab" isn't finished yet.
Apparently, that translates to: $375 is the magic number to buy in.
XPDUSD Buyers Waiting at the Golden Level.Technical analysts are observing potential buying interest in XPDUSD (Palladium versus US Dollar) at the Golden Ratio completion point of a Crab harmonic pattern , specifically around the $911 USD level.
This area is anticipated as a possible support zone where buyers may initiate long positions, predicated on the pattern's predicted reversal.
Copper Bearish Crab Pattern
In 2024, copper prices have exhibited notable fluctuations, driven by macroeconomic trends, industrial demand, and supply constraints.
Key Fibonacci retracement levels have played a crucial role in shaping market movements. With the 0% level at $3.96, the 23.6% retracement at $4.11 acted as an initial support, while the 38.2% level at $4.225 provided stronger stability.
The 50% retracement at $4.28 served as a key equilibrium zone, with the 61.8% level at $4.361 marking a critical support for potential reversals.
According to the harmonic Crab pattern , the 161.8% Fibonacci extension near $5.00 is expected to act as a major resistance. If the price reaches this level, a sharp bearish reversal is likely due to overbought conditions. A rejection at this resistance could drive prices down toward the support zones, completing the harmonic correction phase.
However, a breakout above $5.00 could invalidate this scenario and lead to further bullish momentum.
If you like this trading idea and want to stay updated with the next one, please give it a thumbs up and follow along! Your support means a lot, and I’m excited to share more insights with you. Let’s embark on this journey together!
SEYED.
A double sell pattern on HK50 at price21000 to 21100
Why?
1) This pair is still in a downtrend both of H4 and D1
2) We can see the pair had a pattern earlier yesterday for a sell, now it is a type 2
3) There is another pattern forming for the sell off around the same area
We will observe for another 1 hour to get the best price to enter.
The target if everything falls again would be 1:10 Risk to reward.
Get Ready for the Silver Surge!🚀 Get Ready for the Silver Surge! 🚀
Hey there, silver enthusiasts! 🌟
We're diving into an exciting trend that’s shaping up right at the golden crab level—yes, we’re talking about that sweet spot of **$28.5!**
This is your chance to capitalize on the impending rise in silver prices! With all indicators pointing upwards, now's the perfect time to consider adding some silver to your portfolio.
VIX Angry Crab Is Set to Spike .The VIX Angry Crab is about to make its move, and it’s ready to pinch! Starting from a cozy 18, this volatile crustacean is eyeing its next targets: TP1, TP2, and TP3.
Whether it’s a scuttle upward or a sideways shuffle, traders beware—this crab doesn’t just crawl, it spikes!
Keep your stop-loss nets ready and your trading claws sharp because when the Angry Crab gets riled up, it’s not just a market indicator; it’s a market mood swing.
As always, make your decisions wisely—after all, even the boldest crab can sometimes get caught in a tide.
SEYED.


