CLOVLONG-TERM: Break out of falling wedge, triple bottom at the PCZ of a bullish crab on the 4hr, daily hidden bullish divergence, scaling in could be optimal here. (not financial advice)
Crab

US Tech 100 Daily Deep Crab & ABCD
Tech as met the requirements for a Daily Deep Crab and ABCD pattern. Today's candle closure can be the second candle to close under our HOP entry level. Bearish trend will be established upon closure but is not verified until we get under the 50EMA . Price is also showing respect to the bearish trend line cross.
Price is also staying very close to the HOP level from the previous Deep Crab. Depending on how strong price pulls back towards this level will give us greater insight on the directional bias on the Daily.
My style of trading focuses on flowing with the Harmonic Market Structure price reveals. Price Action , Fibonacci , Wave Sequence s, Moving Averages , and a mixture of Multi Time Frame Confluence . Most importantly the visual realization of emotions cycled into the chart.
As always THANK YOU and if you found this video helpful, please let me know by hitting that like button and/or leaving me a comment below.
Also, feel free to share your opinion on this setup or other setups that you have. The more ideas we can generate together , the more informative these ideas become for newer traders. STAY PATIENT & STAY BLESSED!
~T$

Testing PICORP1. Waiting for BO from point B
2. VPVR show highest volume traded at 0.20 sen in Daily TF

Deep Crab@1.618XADear all, hello again, here I'm coming to give you a brand new analyse to you on US30
Here we can see this beautiful Bearish Deep Crab almost fully, and the price it's 98% close to the PRZ, what I think the price has to make a break cuz we had a big up movement right here, and this a strong harmonic pattern that can make the price go down, no thing to add, you can see with your own eyes!
Rules:
1. Harmonic Pattern Completion - Done;
2. PRZ Hit - Done;
3. PRZ Test - Done;
4. Terminal Bar - Done;
5. Type-1 Reaction - Waiting;
6. Type-2 Reversal - Waiting;
7. Candlestick Reversal Sign - Done;
8. Candlestick Confirmation Sign -Done;
9. RSI Reversal Sign - Done;
10. RSI Confirmation Sign - Done;
11.Risk Management - Applied;
12. Risk / Reward - 1/3.
" Put on therefore, as God's elect, holy and
beloved, a heart of compassion, kindness,
lowliness, meekness, longsuffering.
Colossians 3:12 "

BTCUSD BACK TO 30K ? ...We could potentially see BTC back to the 30K level ... Or even way deeper.
I've always been targeting the 20k level to go more aggressive on bitcoin.
So let's see if this bearish move to 30k goes way deeper to the 20k level.
From there ... to the moon 📈📈📈
.....
This is a crab harmonic pattern.
At a pretty strong resistance area.
Also a 61.8 fib retracement of the overall bearish impulse move from 64K


Gold will rise to 1899 *HARMONIC PATTERN*In the Bearish Crab harmonic pattern, I'm sure gold will rise to 1899
IF BREAK BELOW 1759 THIS PREDICTION WILL BE *FIELDED*

GOLD POSSIBLE POTENTIAL 1795-1828 *HARMONIC PATTERN*I predicted the possible upward in gold, It can rise to 1795-1828
If it rises to 1773 then rebound it should go up to 1796 *Bearish Bat*
If 1784 then rebound it will go to 1828 *Bearish Crab*
If 1791 then rebound it will go to 1811 *Bearish Butterfly*
IF BREAK BELOW 1759 THIS PREDICTION WILL BE *FIELDED*


USDJPY, retracing before going for Daily Support?Crab Pattern. Just an Idea.
I am aiming for the Daily Support at 108.921

EURUSD-Weekly Market Analysis-Aug21,Wk3A Bearish Harmonic Patterns, to be precise a Bearish Crab Pattern has emerged. If this Crab Pattern is going to happen, it will hit 1.1808 by Monday, 16Aug21. If not the setup is just too weak to interest me for the trade.
What's nice on this setup is that the Harmonic Pattern completes within the consolidation zone.

BTC 1DBTC forming bearish crab pattern on the daily time frame
we might see a bearish reversal from here
Follow me for more updates

4HR Deep Crab Harmonic PatternEURGBP made a 50% correction from a 4HR Deep Crab! Amazing entry off the Type 1 Reaction.
My style of trading focuses on flowing with the Harmonic Market Structure price reveals. Price Action , Fibonacci , Wave Sequence s, Moving Averages , and a mixture of Multi Time Frame Confluence . Most importantly the visual realization of emotions cycled into the chart.
As always THANK YOU and if you found this video helpful, please let me know by hitting that like button and/or leaving me a comment below.
Also, feel free to share your opinion on this setup or other setups that you have. The more ideas we can generate together , the more informative these ideas become for newer traders. STAY PATIENT & STAY BLESSED!
~T$

btc/usdt Dailymy next idea about btc/usdt in daily time frame ... go long after correction!
not financial advice . deal with your trading system.

Potential Deep Crab Potential deep crab forming, I took the first trade as a swing and took 70 pips from it, now, hoping for this deep crab patter to form!
Price is trending upwards so the pullback should be inevitable! (Also Im still in the first swing so it better do!! haha)

BITCOIN still on track to up ($49,000)As we know in the chart BITCOIN is still on track to push to $49k and will correction to $42k, but unfortunately BITCOIN make a bearish crab pattern. So will see if BITCOIN can breakout from $51k resistance, it can surprising us.

ETH is forming a CRAB Pattern!It seems ETH is forming a CRAB Pattern and is likely targeted $8,550 ...

Bearish Deep Crab in NiftyBearish Deep Crab in Nifty (SL on 15 min. candle close)
PRZ for Sell 16138
SL 16525
Target : 15880, 15830
CMP 16258 @ Aug 09, 2021
Chart by CA Savita Rehlan

Bearish Crab in NiftyBearish Crab in Nifty (SL on 15 min. candle close)
PRZ for Sell 16069
SL 17254
Target : 14884, 14151
CMP 16258 @ August 9, 2021
Chart by CA Savita Rehlan

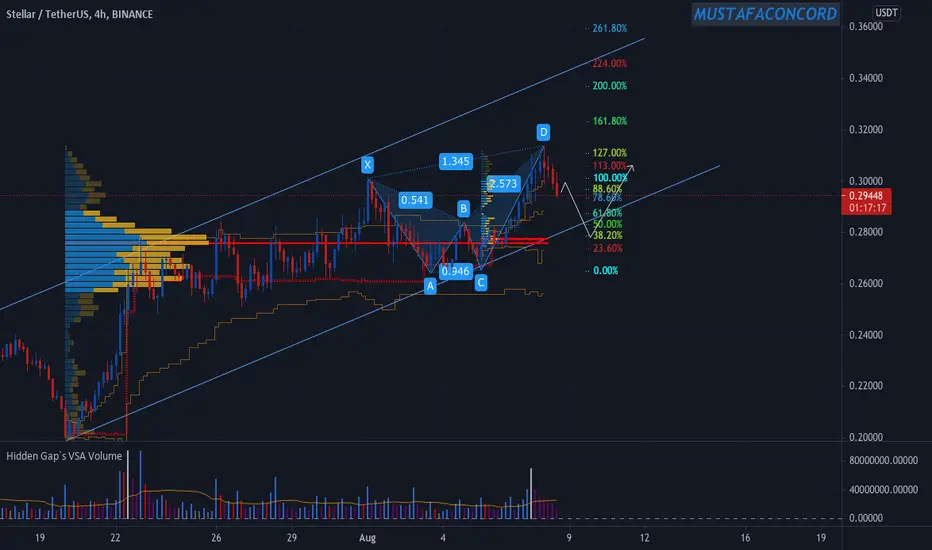
CRAP PATTERN SETUP WITH VOLUME REJECTION SETUP we have clear crab pattern and expecting rejection level at the POC
Bearish Crab Revisited. Bitcoin To 48-49k Then DownBearish crab like structure is still something i feel confident in. However it is going a little higher on this part (How crabs normally form). 48-49k area is a retest similar to august-september 2020 Retest of the 12k breakdown.

Potential sell opportunity on BTCUSDThat'll be an interesting zone to watch out for.
Sell potential.
Deep Crab pattern.

Simple Ideas Big Gartley and Small Crab Pattern (9 Aug - 13 Aug)I use simple method. Just PA and Harmonics.
2 harmonics pattern seem to have approximately same D point area.
might be good to look for.
However guys, please look for confirmation for entry.
Better ride in late than hop early to the wrong turn.
Happy Trading Guys.
