Crab


Forming of The Crab Pattern in BNBUSDT PairIt looks like The Crab pattern is forming in BNBUSDT pair, I use 1H TF to predict the price movement in BNBUSDT pair.
The Crab pattern is considered by Carney to be one of the most precise of the patterns, providing reversals in extremely close proximity to what the Fibonacci numbers indicate. Harmonic trading is a precise and mathematical way to trade, but it requires patience, practice, and a lot of study to master the patterns. The basic measurements are just the beginning. Movements that do not align with proper pattern measurements invalidate a pattern and can lead traders astray
Note: Please manage your risk by not doing over-leverage and set your STOPLOSS .

Godrejcp - Bearish Crab 🦀 and WolfewaveGodrejcp has bearish crab at weekly TF and wolfewave on daily . Shark in progress,forecast as target...

RESMID-TERM: Bullish gartley AND bullish crab potentially double bottoming at the same PCZ level, which is a historical area. Daily classic bullish divergence on the RSI. (not financial advice)


BTCUSDT continues to move upThe harmonic pattern has broken out 0.786 and now is targeting 1.13. Is it possible to move up to 1.618 ?

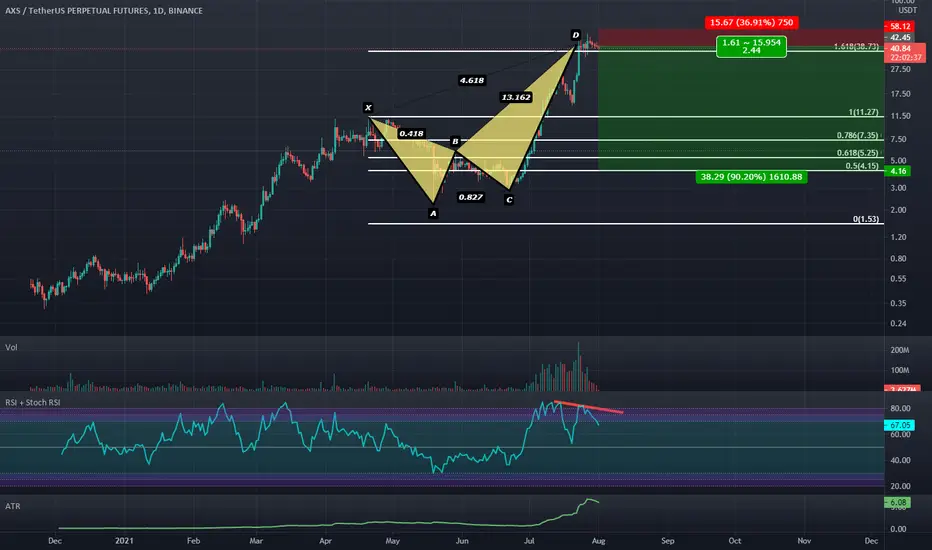
RSI Bearish Divergence at 1.618 Log-Scaled PCZ of a Bearish CrabVery Similar to the Bearish Log Scale Butterfly i found on Bitcoin. This setup however does not have the best risk to reward due to the high volatility of this coin. i suggest that if you trade it not to risk a huge amount of cash.
USDCHF - Deep crab and Fibonacci ClusterHey guys,
Welcome to my first analysis on the international platform. I ususally only post my ideas on the german channel, but i set myself the goal to change that.
I mostly work with harmonics and wolf waves.
Here you can see a deep crab with a TD count in the H4 timeframe and Fibonacci clusters which you can see through out the updates. Take Profits are the green Retracements. :)
if you likes my post, ii would be happy to see a like or follow for more ideas on this channel.
-No financial advice


crab harmonic pattern with negative divergenceBTC have a strong support at $34000 and $32000 but it's possible loss these supports. I can't see lower than $31310.
crab harmonic pattern:
AB=0.61 XA
BC=0.88 AB
tp1=1.6 BC=$34121
tp2=1.6 XA=$31310
tp3=2.6 BC=$30745
tp4=3.6 BC=$27723

BTC/USD (Short) Bearish Setup Bitcoin bearish continues till 25k. Looks like we gonna taste our new support level.
Educational purpose only. Not a investing advice.


ETH crab pattern#ETHUSDT
$ETH broke out a descending resistance and now pullback to confirm it as support.
Here is a Crab pattern that if #ETH going to complete it price will reach $3000 and $3400 in coming days.

Glenmark - Deep Crab and Bearish WolfewaveGlenmark at prz of Deep crab and also forming bearish wolfe wave. Target on chart...

BTC Countdown to CrabtownEach push getting weaker, indicators indicating flagging or down instead of flagging or up... Yea, this is when you consider a short. Could go either way, but I think we cool off back to 31k at least, before we have a shot at returning to bullishness. There are a few stronger support areas now though on the way down. Set stop loss accordingly.
Crab claw coming down, don't get pinched!

Potential Deep Crab Potential Deep crab forming on USDJPY Daily chart along with bearish gartley on lower timeframe giving us more confirmation price could potentially be moving towards these targets.
I will wait for markets to open and let price settle before publishing updates, but at the moment USDJPY looks long in the short term!

Gartley + Deep Crab EURUSD - We have a potential Gartley pattern forming on the daily with a potential deep crab forming on the 4H chart, both patterns confirm each other, (Last week we had a potential ABCD but after more studying i've found stronger potential bullish movement) current price still hasn't broken previous structure (It's sitting on the quaterpoint) if structure doesn't break and price continues to rise with confirmations of wicks/candles then I will be buying in.
Lets wait for the market to open/price to settle and take it from there!

Bitcoin ... Three-Peat ??
The $29,000 to $31,000 area has provided good support for 2021.
Twice Harmonic patterns (Shark and Deep Crab Patterns) have reversed trend around these levels on a daily basis,
Now we have a Bat pattern, albeit on a 5 hour basis
Is this enough to reverse the trend in place since mid June ?
Perhaps but I'd like to see a bottom in first which is why my entry level is not a current levels.
To be fair Deep Crab patterns (rose colored) can overextend to the $25,000 area.
Bottom line: This is a support area worth watching, bolstered by my bottom window propriety indicator, which appears in a reversal zone and has had a reasonable success rate.
As always do your own due diligence, trade within your means and accept losses as part of your trading education
(Note this is a daily chart and there may be a lot of range volatility in each bar.)
S.


Potential Bearish Deep Crab Potential Bearish Deep Crab Forming , will study price action and if price continues bullish I will scalp long towards the completion
