Consolidating the UFT trendApril is the month of the strongest seasonal growth in the first half of the year. In the first half of the month, the probability of purchase disruptions prevails against the background of the negative closing of the last quarter, however, as we approach the middle of the month, the probability of a stable bullish trend with a sharp reversal for individual coins will begin to increase.
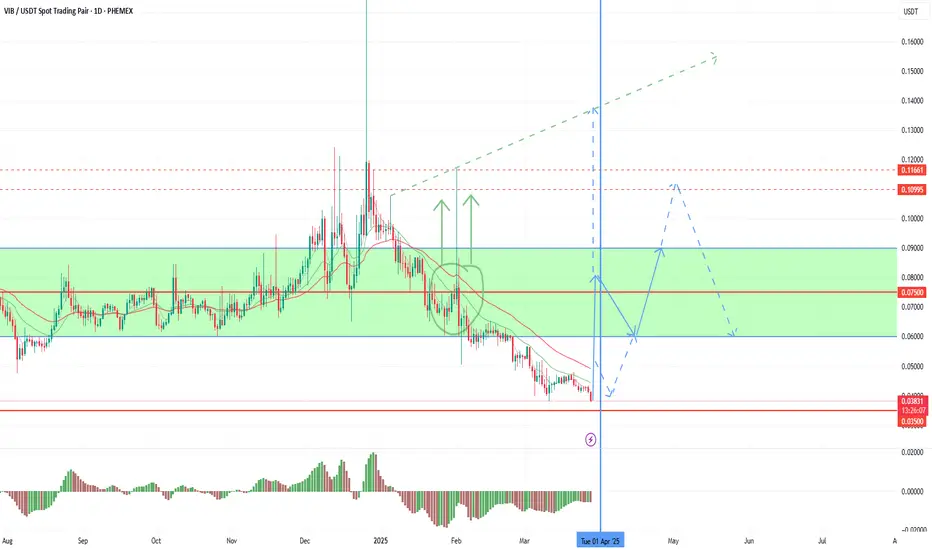
Today I want to once again draw your attention to uft, which gave you two waves of 40-50% each and good opportunities to slip up. Unfortunately, we did not see a stable reversal on the quarterly candle due to the negative overall market dynamics and the falling altcoin index. However, the new quarter opened above the strong 0.075 support, which provides an opportunity for a hike to 0.15 and a stable trend. Purchases from the current 0.05 level can bring up to 3-5X in the absence of delisting and the beginning of a trend.Also, in the second wave, a breakout signal is left, and in the case of an exit above 0.11 from the third wave, there is a high probability of a trend to retest 0.21-25 with intermediate resistance at 0.150-175. A similar pattern has already worked out last week on a smaller timeframe.
Vib troy pda alpaca voxel cream can also show powerful growth impulses among coins with the monitoring tag and fio pivx bifi among coins without the tag. Coins with the monitoring tag often show good dynamics in the second half of the week due to the low probability of delisting. In the first half, it is worth keeping a stop loss close to the price in case of delisting until noon.
Cream

New opportunities for earning money on VIPTo date, we have come close to a change in the quarter and a high probability of increased volatility. The second half of the monthly candle on ether opened in the negative zone, which gives a signal to hold sales until the end of the quarter. However, in recent days, individual coins have the opportunity to work out their accumulated potential with a bullish reversal of the monthly candle. VIB is currently the most oversold coin without the monitoring tag. Against the background of the pinbar of the last monthly candle, there were few buyers this month, but technical buy signals were left up to a 0.1 retest even with the current market position.
In an optimistic scenario, today's daily candle may turn bullish with continued purchases until the end of the quarter. Negative statistics on the United States today may contribute to this. In the case of a reversal in the current quarter, the target may be a local breakout and retest of the trend line formed by the previous breakdown.
With less volatility and strong statistics coming out in the US today, the probability of a rebound from the retest of past hows in the range of 0.110-125 and a transition to a flat near the key long-term level of 0.075 +-15 prevails. In this case, the start of purchases may be delayed until the opening of a new quarter, or the next announcement on the assignment of the monitoring tag.
The main long-term support is 0.035, a hike below which is possible only under extraordinary circumstances with the withdrawal of ether by 1,500, the dominance of alcoins by 7.5% or the assignment of the monitoring tag. Given the current oversold conditions and high targets, assigning the tag will only give a temporary departure below 0.035 with further growth to 0.075, similar to vidt.
In addition to vib, among coins without the monitoring tag, so far I am considering only pda with a possible new wave of growth, especially if the tag is not assigned in the new month.
The coins that already have the monitoring tag are the most oversold on binance, due to which they have shown good growth impulses in the last two weeks against the background of attempts to reverse the quarter. Before the next delisting announcement, there is time for new waves to reverse the current quarter under an optimistic scenario, as vidt shows, and a pullback already in the new quarterly candle. The most interesting scalping companies among this group today are uft troy alpaca with a growth potential of up to 100%+ and cream nuls with a possible growth of up to 50%+.
Quarter reversal from the weekendTo date, we are clearly moving along the scenario outlined in the last review and are approaching an important bifurcation point and the possibility of purchases or toppings by position. The market remains under the influence of multidirectional signals. On the one hand, the positive opening of the quarter gives rise to a powerful market buy-off for the reversal of the quarterly candle for coins. On the other hand, the negative opening of the second half of the quarter delays this wave of purchases. As a result, the growth wave in the middle of the quarter was rather weak, although it was comforted by good growth waves for individual coins. As a result, the main purchases, as mentioned in previous reviews, are expected in the last monthly candle of the quarter.
Against the background of the end of the sales period, the bears have the last opportunity to test 2600 on the air today and tomorrow. Sales attempts will be made against the background of the planned powerful statistics for the United States. Judging by the technical picture, the levels of 2500 and 2600 for ether will not be broken, and as we approach the end of the month, we will see an increase in purchases of altcoins from the weekend, with major breakouts in the new month.
In the most optimistic scenario, the statistics will be negative and will give an opportunity to hike above 2750 this month.
Among the coins to work with, I mainly consider vib og alpaca uft pda vidt in the medium term with likely growth waves up to 70-100%, according to which I will consider increasing the position by the weekend. Ast burger pivx wing quick looks just as good for scalping, with likely growth waves of up to 30%+ at least.
Among the coins with the monitoring tag, troy still looks the most interesting, with open targets in the range of 0.0032-35 and a possible breakout at a retest of 0.0050-75 with a positive market. I am also considering hard and cream for scalping.
According to vite, which unfortunately did not fulfill the technical goals left, there is a fairly high probability of an exit pump over the weekend with an attempt to reverse the weekly candle against the background of its opening above 0.0075 and the bullish last candle. In an optimistic scenario, especially in the case of negative statistics on the United States, there is a possibility of growth up to 0.0125-150-210 , similar to the exit pump of gft, which closed its intended targets before delisting. In a more negative scenario and low volatility, a pullback from the 0.0075-60 levels is likely over the weekend, which can already bring up to 150% profit. I recommend investing in this scenario after the statistics are released and the risk of additional drawdown is reduced. Today and tomorrow, the potential of the 0.0020-25 test remains before the pump. It is also worth weighing the extremely high risk of such an investment. Powerful technical signals remained for this token, up to a retest of 0.021-25, and therefore, after delisting from binance, there is a possibility that these goals will be fulfilled. If the coins remain in stock after delisting, it makes sense to hold them until the end of the attempt to reverse the quarter on the market until the end of April.

Preparing for powerful purchases at the turn of the quarterTo date, the market has come to a new opportunity for purchases and another market review. For the bear market, the pullback on the last monthly candle worked well, vib cream og troy performed well with growth impulses up to 30%+. However, as I emphasized, we still have the potential to go to 75k in bitcoin and below, and therefore we continue to catch only pullbacks on large charts against the bear market. I still recommend carefully weighing the top-up for large-cap coins, as such assets may continue to fall until the fall.
In the coming week, we are approaching the key bifurcation point – the middle of the quarter. There is still time before this day for the bears to attack, however, the opening of the month on ether above 3250 is likely to compensate for the attempt of a new loy test in the new week. Due to this picture, there is a fairly high probability of a pullback and an attempt to change the trend today. If the successful extinguishing of sales continues, we can expect an exit to 3100 on ether by the end of the week and in the case of opening a new weekly candle above 3000-3100, continued purchases with the aim of turning the monthly candle into a bullish one. In a more negative scenario, customer activity will remain rather weak with an increase in purchases as we approach the middle of the quarter. In this case, at the beginning of the week, there is a possibility of new sales attempts on the 2600 retest with an increase in purchases from the middle of the week.
Depending on the opening of the second half of the quarter above / below 3250, it will be possible to make a forecast about the further movement of the market.
To date, ether has tested the main medium-term support of 2500, for a fall below which there are no arguments yet when bitcoin is held above 90k, the euro above 1.025 and wti oil above 70. If one of the assets goes below one, there will be a risk of the alt market sinking to an additional 30-40% from current levels. At the moment, the probability of holding these assets above the levels with a gradual reversal of the altcoin market and attempts to turn the quarterly candle into a bullish one for individual coins prevails. That is, in the second half of the quarter, there is a probability of a large bull run with coin impulses up to 100%+.
To date, coins such as vib og alpaca pda vidt have reached the medium-term bottom, which I primarily consider for storing funds in the medium term and additional scalping. In case of market disruptions, drawdowns of no more than 20-25% are likely when tested with ether 2500-2600. The growth potential for these coins is to exceed the opening level of this month with an increase of up to 50% in the short term and a reversal of annual candles in the medium term with an increase of up to 100%+. We also reached powerful supports for uft wing combo slf quick pivx ast, which can slide to 30-35% lower in the event of ether disruptions, but they also look good in the mid-range with a growth potential of up to 70%+ in the event of a bullish reversal of the annual candle in the future.
Coins with the monitoring tag are still the most oversold. Among them, vite stands out, which gave good breakouts at every opportunity. The growth potential remains up to 0.021-25, which can give up to 300% profit. Cream troy amb hard remains in an extremely oversold position with a growth potential of up to 100%+. Troy stands out strongly, which, unlike cream, did not retest the drop level by 0.0031-35, this rebound can bring up to 150%+.
Let me remind you that coins with the monitoring tag are subject to the threat of delisting, which most often occur in the first half of the week, and therefore it is worth keeping short stops at the current price at the beginning of the week or taking assets into operation in the second half of the week.

The altcoin market has reached its goal, we are catching reversaThe market remains quite boring for now, but we are nearing the end of a steady decline and the opportunity for growth in alcohols, I think it's time for another review. First of all, I want to note that there are not yet sufficient arguments for going to 75k for bitcoin, which I recommend that you keep in mind since the end of the year to understand the medium-term prospects of the market and the depth of immersion of the alt market.
Last week, there was a fairly large wave of dollar sales, which completely stopped the trend of its strengthening, but has not yet given a reliable trend change. If the dollar continues to fall this week with the euro consolidating in the range of 1.050-75, then bitcoin will give a new wave of growth towards 110-115 with further attempts to reverse the month for altcoins. So far, this scenario has prevailed by a small margin in my opinion. The statistics coming out will play an important role, especially the negative ones for the United States. In a negative scenario, the euro will fall below 1.045 again, which will cause the crypto to get stuck in a sluggish flat.
In the first half of the week, the probability of maintaining sales within the framework of shadow drawing according to the current weekly candle prevails. From Wednesday to Friday, buyers will start looking for reasons to buy back coins with a weekly reversal turning into a monthly reversal in an optimistic scenario for individual coins.
However, once again I would like to draw your attention to the fact that the goals for bitcoin up to 60-75k remain relevant and are highly likely to be fulfilled closer to the summer. At the moment, we are only looking for scalping opportunities against the bear market, while bitcoin remains flat in the range of 90-110. It is not necessary to top up large-cap coins that are in drawdown, as the fall is highly likely to continue until autumn.
The alt dominance index reached the target level on the 9% test, which I indicated. In this regard, after the rebidding, the probability of a slow reversal of the altcoin market prevails with targets up to 12.5-15% according to the altcoin dominance index. The formation of this reversal partially compensates for the likely drawdown of bitcoin.
In the current market, coins with the monitoring tag have taken the most interesting position, as they are in the most oversold position. Vite stands out strongly, which closed the last weekly bullish candle, which is highly likely to lead to a reversal this week to 0.0150-75. There is also a high growth potential for cream troy hard for an attempt to reverse the month.
Let me remind you that coins with the monitoring tag have a constant threat of delisting, which most often occurs from Monday to Wednesday before lunch. At this time, it is worth keeping a short stop on these coins at the current price, or scalping with these tools in the second half of the week. Despite the delistings, the coins of this group have always brought significant profits due to frequent oversold prices and very volatile growth impulses.
Among coins without the monitoring tag, vib and ast stand out the most. However, it is worth considering the incomplete issue of ast, which can lead to an additional drawdown if coins are added to circulation. Also interesting for scalping are pda vidt alpaca og pivx amb wing uft slf with possible growth waves up to 50-70%. Quick and combo, which are suitable for medium-term storage of funds, are also suitable for strong support, as they are fairly reliable projects. Combo (formerly cocos) already pleased us with X's in 21-22, when I recommended him to work.

CREAMUSDT 1WCREAM ~ 1W
#CREAM in the past this support block bounced the price of this coin,. If this happens again this support block would be a very good buy for now.

%450 DAILY VOLUME SPIKE: Is This the Calm Before the Storm? CREAMUSDT: Is This the Calm Before the Storm? 🤔
Here’s what I’m seeing:
Volume Explosion: A massive 450% daily volume spike—that’s no small feat!
Buyer Activity: Surprisingly, buyers haven’t shown significant action yet.
CDV Signal: Cumulative Delta Volume (CDV) is looking very positive, which is intriguing.
It’s a puzzling setup, but if the right scenario unfolds, I might take the chance. I’ll be watching closely for a clear confirmation—lower time frame bullish market structure breaks and solid volume backing my entry.
Stay tuned for updates. Don’t miss it! 🚀
Let me tell you, this is something special. These insights, these setups—they’re not just good; they’re game-changers. I've spent years refining my approach, and the results speak for themselves. People are always asking, "How do you spot these opportunities?" It’s simple: experience, clarity, and a focus on high-probability moves.
Want to know how I use heatmaps, cumulative volume delta, and volume footprint techniques to find demand zones with precision? I’m happy to share—just send me a message. No cost, no catch. I believe in helping people make smarter decisions.
Here are some of my recent analyses. Each one highlights key opportunities:
🚀 RENDERUSDT: Strategic Support Zones at the Blue Boxes +%45 Reaction
🎯 PUNDIXUSDT: Huge Opportunity | 250% Volume Spike - %60 Reaction Sniper Entry
🌐 CryptoMarkets TOTAL2: Support Zone
🚀 GMTUSDT: %35 FAST REJECTION FROM THE RED BOX
🎯 ZENUSDT.P: Patience & Profitability | %230 Reaction from the Sniper Entry
🐶 DOGEUSDT.P: Next Move
🎨 RENDERUSDT.P: Opportunity of the Month
💎 ETHUSDT.P: Where to Retrace
🟢 BNBUSDT.P: Potential Surge
📊 BTC Dominance: Reaction Zone
🌊 WAVESUSDT.P: Demand Zone Potential
🟣 UNIUSDT.P: Long-Term Trade
🔵 XRPUSDT.P: Entry Zones
🔗 LINKUSDT.P: Follow The River
📈 BTCUSDT.P: Two Key Demand Zones
🟩 POLUSDT: Bullish Momentum
🌟 PENDLEUSDT.P: Where Opportunity Meets Precision
🔥 BTCUSDT.P: Liquidation of Highly Leveraged Longs
🌊 SOLUSDT.P: SOL's Dip - Your Opportunity
🐸 1000PEPEUSDT.P: Prime Bounce Zone Unlocked
🚀 ETHUSDT.P: Set to Explode - Don't Miss This Game Changer
🤖 IQUSDT: Smart Plan
⚡️ PONDUSDT: A Trade Not Taken Is Better Than a Losing One
💼 STMXUSDT: 2 Buying Areas
🐢 TURBOUSDT: Buy Zones and Buyer Presence
🌍 ICPUSDT.P: Massive Upside Potential | Check the Trade Update For Seeing Results
🟠 IDEXUSDT: Spot Buy Area | %26 Profit if You Trade with MSB
📌 USUALUSDT: Buyers Are Active + %70 Profit in Total
🌟 FORTHUSDT: Sniper Entry +%26 Reaction
🐳 QKCUSDT: Sniper Entry +%57 Reaction
📊 BTC.D: Retest of Key Area Highly Likely
This list? It’s just a small piece of what I’ve been working on. There’s so much more. Go check my profile, see the results for yourself. My goal is simple: provide value and help you win. If you’ve got questions, I’ve got answers. Let’s get to work!

CREAMUSDT Analysis And Next Market MovePair Name = CREAMUSDT
Market = Crypto
Timeframe = H12
Analysis = technical + fundamentals
Trend = Bullish
Pattern= Falling Wedge
Details:-
CREAM is making the falling wedge pattern. Waiting for a good volume. After getting good volume we will see a good breakout. After breakout Expecting 80%+ gain.
Bullish Target:-
20.000
25.000

#CREAM/USDT#CREAM
The price is moving in a descending channel on the 1-hour frame and is sticking to it well
We have a bounce from the lower limit of the descending channel and we are now touching this support at a price of 12.60
We have a downtrend and the RSI indicator is about to break, which supports the rise
We have a trend to stabilize above the moving average 100
Entry price 12.80
First target 13.52
Second target 14.20
Third target 15.00

CREAMUSDT.1DUpon examining the 4-hour chart of CREAM/USDT, I notice several pivotal technical factors that offer a comprehensive understanding of the current market situation and potential future price movements.
Technical Analysis Observations:
Support and Resistance Levels (S1, R1, R2):
Support Level 1 (S1): At approximately $39.85, this level has acted as a crucial support and a possible floor for the recent downward movement. A failure to hold this support could lead to further declines.
Resistance Level 1 (R1): Located at $65.00, this level will serve as the first major hurdle for any bullish correction attempts.
Resistance Level 2 (R2): At $87.98, this higher resistance level marks a significant recovery target in a more extended bullish scenario.
Trend Indicators:
The price has been in a clear downtrend as marked by the descending price action. The support at S1 will be critical to watch for any signs of reversal.
The price action between the support and resistance levels indicates a range-bound movement, where traders should watch for breakouts or breakdowns from this range to determine the next major move.
RSI (Relative Strength Index):
The RSI is at 36.00, suggesting that while the asset is not yet in the oversold territory (below 30), it is close. This could indicate potential for a further drop but also suggests that we are approaching levels where buyers might start to come in.
MACD (Moving Average Convergence Divergence):
The MACD is below the signal line, and the histogram is showing negative values, indicating bearish momentum. However, the lines are flattening, which could hint at a potential slowdown in bearish momentum and a possible upcoming crossover.
Conclusion:
The CREAM/USDT pair is currently testing a significant support level around $39.85. The proximity of the RSI to oversold levels and the flattening of the MACD suggest that we may be nearing a point of reversal or at least a short-term consolidation. However, the prevailing bearish sentiment underscored by the MACD means caution is warranted.
For potential trading strategies, I would look for a confirmation of a reversal signal at the support level, such as a bullish divergence on the RSI or a MACD crossover. If the price breaks above the immediate resistance at $65.00, it could signal the start of a bullish trend, with a target towards $87.98. Conversely, a decisive break below $39.85 would suggest further downside, and monitoring the price action closely for new support levels would be essential.
Risk management remains crucial in such volatile conditions. Setting stop-loss orders just below key support levels and taking profit near resistance levels can help manage potential risks and optimize gains.

CREAMUSDT.1DThe CREAM/USDT pair currently trades at $69.75, showing significant volatility in recent months. The daily chart highlights a series of fluctuations, with current pricing pressures suggesting a bearish sentiment.
Key Support and Resistance Levels:
Resistance 1 (R1): $55.09 - This level is critical as it has previously served as a strong resistance point. The price is currently below this level, which might continue to act as a ceiling in the short term.
Resistance 2 (R2): $103.92 - This is the highest recent resistance level, significantly above the current price, suggesting a strong upward move would be needed to test this.
Support 1 (S1): $39.37 - Currently, this support level is crucial. If the price drops below this, it could indicate a significant bearish trend.
Support 2 (S2): The chart shows a support around $27.70, indicating a lower boundary set during the recent lows.
Technical Indicators:
MACD: The MACD line is below the signal line, and both are trending downward below the zero line, indicating strong bearish momentum.
RSI: The Relative Strength Index is approximately at 49, suggesting a neutral position. However, its proximity to the oversold territory indicates potential volatility and downside risk.
Analysis Conclusion:
The CREAM/USDT market shows signs of stress with a potential bearish bias as indicated by the prevailing lower highs and the MACD configuration. The critical support at $39.37 will be vital to watch in the coming days. A break below this level could lead to further declines, testing the $27.70 support zone.
Given the current market setup and the resistance at $55.09 acting as a near-term ceiling, my outlook remains cautious. Traders should prepare for potential volatility with a close watch on the indicated support and resistance levels. A breach above the immediate resistance at $55.09 could alter the bearish outlook, suggesting a reevaluation of the current trading strategy.

CREAMUSDT.1DUpon examining the CREAM/USDT daily chart, several critical technical indicators and levels are evident, offering insights into potential price movements.
Trend and Resistance Analysis:
The chart shows that Cream Finance (CREAM) has experienced a significant price increase, currently trading around 84.53 USD. The price recently spiked to a high of 97.97 USD before retracing. There are two major resistance levels to watch: R1 at 85.60 USD and R2 at 113.22 USD. The price is currently testing R1, and a successful break above this level could see it testing R2, indicating further bullish momentum.
Support Levels:
On the downside, the primary support level is identified as S1 at 73.70 USD. This level has shown strong buying interest and could act as a floor if the price continues to decline. Below S1, the next significant support level is S2 at 56.46 USD, which has been a critical support zone in the past.
RSI and MACD Indicators:
The Relative Strength Index (RSI) is currently at 79.91, indicating that the asset is in the overbought territory. This suggests that the asset might be due for a correction or consolidation before any further upward movement. The Moving Average Convergence Divergence (MACD) indicator is showing strong bullish momentum, with the MACD line (blue) well above the signal line (orange)
and a positive histogram. However, the overbought RSI warrants caution.
Volume Analysis:
The volume pattern indicates that the recent price spike was accompanied by significant trading volume, suggesting strong market participation during upward movements. This heightened volume reinforces the bullish sentiment but also indicates the potential for volatility.
Conclusion:
In conclusion, the CREAM/USDT pair is currently in a strong bullish trend but is showing signs of being overbought according to the RSI. The MACD supports continued bullish momentum, but the overbought RSI suggests that a correction or consolidation might be imminent. Traders should closely monitor the support levels at 73.70 USD and 56.46 USD, as well as the resistance levels at 85.60 USD and 113.22 USD. A break above the resistance levels would confirm continued bullish momentum, while a failure to hold the support levels could lead to a deeper retracement.
Overall, the market sentiment for CREAM remains cautiously optimistic, with critical attention needed at the aforementioned levels and indicators to make informed trading decisions.

CREAM Surges with Breakout Momentum: Eyes Set on $100!
Key Observations:
Ascending Channel Breakout:
The price has been trading within an ascending channel, with higher highs and higher lows.
A breakout from the channel is observed, with the price rising sharply from around $43 to $71.34 , indicating strong bullish momentum.
Support and Resistance Levels:
Major support levels identified: $15.59 and $42.34.
Major resistance levels identified: $58.57, $70.50 , and $100.45.
Volume and Price Action:
The volume appears to have increased significantly during the breakout, confirming the strength of the upward movement.
Candlestick Patterns:
The chart shows a large bullish candlestick, indicative of strong buying interest.
Indicators:
Stochastic RSI at the bottom of the chart is showing an underbought condition (below 20 level). This may indicate potential for a long-term bullish.
Technical Analysis:
Breakout Confirmation:
The price broke out of the ascending channel with a strong bullish candle, suggesting a possible continuation of the uptrend.
After breaking above $58.57 (previous resistance), the price surged to $71.34, confirming the breakout.
Potential Pullback:
Given the overbought condition on the Stochastic Oscillator, a pullback or consolidation phase might be imminent before further upward movement.
A retest of the breakout level around $58.57 or even the $42.34 support level is possible, which would be a healthy correction.
Price Targets:
Short-term target : The price could aim for $70.50 again, as it is the immediate resistance.
Mid-term target : If the bullish momentum continues, the next target would be $100.45, which aligns with the measured move from the breakout.
Long-term target : Sustained momentum could push the price beyond $100.45, but this would require continuous strong buying pressure and favorable market conditions.
I will keep updating this chart overtime


$CREAM performing symmetrical triangle$CREAM performing in 1hr symmetrical triangle
Trading a symmetrical triangle pattern involves identifying potential breakouts and using technical analysis to make informed trading decisions. Here are the steps to trade a symmetrical triangle pattern:
1. **Identify the Symmetrical Triangle:** First, recognize the formation of a symmetrical triangle on a price chart. This pattern typically consists of converging trendlines, with a series of higher lows and lower highs, creating a triangular shape.
2. **Determine the Direction:** Pay attention to the direction of the price trend leading into the triangle. If the price was in an uptrend before entering the pattern, there's a higher likelihood of a bullish breakout. Conversely, if it was in a downtrend, a bearish breakout is more probable.
3. **Set Entry and Stop-Loss Levels:** To trade a symmetrical triangle, you'll want to wait for a breakout from the pattern. Set your entry order slightly above the upper trendline for a bullish breakout or slightly below the lower trendline for a bearish breakout. Place a stop-loss order to limit potential losses.
4. **Confirm the Breakout:** Don't jump the gun. Wait for a confirmed breakout, which is usually accompanied by increased volume and a significant price movement beyond the trendline. This confirms the direction of the breakout.
5. **Measure the Price Target:** Use the height of the triangle at its widest point to estimate the price target. For a bullish breakout, add this measurement to the breakout point; for a bearish breakout, subtract it. This provides an initial price target.
6. **Monitor and Adjust:** Keep a close eye on your trade and adjust your stop-loss and take-profit levels as the price moves. This will help protect your profits and minimize losses.
7. **Consider Volume and Confirmation:** While symmetrical triangles often result in significant breakouts, not all breakouts are equally reliable. Look for strong confirmation through volume and other technical indicators (such as moving averages) to increase the reliability of your trade.
8. **Practice Risk Management:** Only risk a small portion of your trading capital on any single trade, and don't over-leverage. Stick to a risk-reward ratio that makes sense for your overall trading strategy.
Remember that trading involves risk, and it's important to have a solid understanding of technical analysis, risk management, and a trading plan before attempting to trade any chart patterns, including the symmetrical triangle. It's also advisable to practice on a demo account or paper trade to gain experience before risking real money.

$CREAM still so look bullish$CREAM Performed Bullish Symmetrical in 1D TF
What is a Symmetrical Triangle
A symmetrical triangle is a chart pattern characterized by two converging trend lines connecting a series of sequential peaks and troughs. These trend lines should be converging at a roughly equal slope. Trend lines that are converging at unequal slopes are referred to as a rising wedge, falling wedge, ascending triangle, or descending triangle.
KEY TAKEAWAYS
Symmetrical triangles occur when a security's price is consolidating in a way that generates two converging trend lines with similar slopes.
The breakout or breakdown targets for a symmetrical triangle is equal to the distance between the initial high and low applied to the breakout or breakdown point.
Many traders use symmetrical triangles in conjunction with other forms of technical analysis that act as a confirmation.
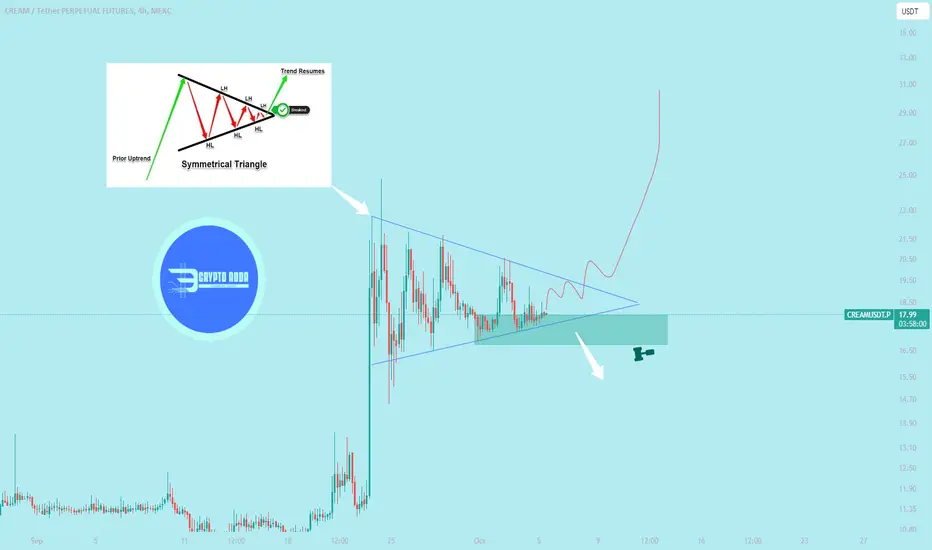
$CREAM Performed Bullish Symmetrical$CREAM Performed Bullish Symmetrical in 2hr TF
What is a Symmetrical Triangle
A symmetrical triangle is a chart pattern characterized by two converging trend lines connecting a series of sequential peaks and troughs. These trend lines should be converging at a roughly equal slope. Trend lines that are converging at unequal slopes are referred to as a rising wedge, falling wedge, ascending triangle, or descending triangle.
KEY TAKEAWAYS
Symmetrical triangles occur when a security's price is consolidating in a way that generates two converging trend lines with similar slopes.
The breakout or breakdown targets for a symmetrical triangle is equal to the distance between the initial high and low applied to the breakout or breakdown point.
Many traders use symmetrical triangles in conjunction with other forms of technical analysis that act as a confirmation.

We passed the sluggish middle of the block. we are preparing forStarting tomorrow, the last month of the current quarter opens, I think it's worth summarizing the interim results and assessing the prospects. This month was extremely sluggish, because it is central in the quarter and there was a struggle for the direction for the second half of the quarter. After passing through the middle of the quarter, we saw a significant breakthrough in the dominance of the altos and an attempt to move to growth on the air. In the medium term, the dynamics are quite good, because the current monthly candle shows the predominance of purchases on the ether, which with a high probability can become a signal for purchases until the end of the quarter and, accordingly, the first half of the year with the opening of a new semi-annual candle with growth.
In an optimistic scenario, a new monthly will open above 1850, which will lead to an increase in the area of 2500 within a month or two. When opening below 1850 in the new month, there is a possibility of a deeper pullback on the quarterly and semi-annual schedule with test attempts of 1750 and 1600, which will significantly complicate the situation, but so far the probability of this is significantly inferior.
So far, I continue to closely monitor uft vib pros for cvp wtc ooki dock perl pnt asr atm, where the largest number of unprocessed targets remain. Transferring some coins to the innovation zone, as I assumed, is a common speculation, immediately followed by a buy-off on drep with the development of goals and significant activity of buyers on perl and pnt. After trading, I think perl will show no less interesting dynamics than drep with an attempt to test the 0.06-75 range, as soon as the ground appears against the background of the growth of the dominance of altos or ether. The transfer from the launchpad zone to the innovative one, in my opinion, is an increase in the status for the token. According to torn, there is also a series of speculations in my opinion, in order to throw off the crowd and hold the violas at the bottom, which requires negative rumors and examples. While technical goals remain up to $ 17-21, I continue to hold positions on it.
They are inferior in potential, but they have come to powerful epx front gft amb supports that can show an increase of up to 70-100%. They are also approaching supports with possible rebounds up to 40-60% wing akro srm farm snm fis om vite hard voxel df.
In the new month, I expect the growth of the eth/btc pair to continue in the area of 0.100-125. That is, attempts to increase the ether even in the case of a cue ball going to retest 21-22.5K. But it is still difficult to say whether the growth of the ether will help the violas break away from the cue ball.

CREAM tradin idea (BUSD)Support at 10$ and 7$. Immediate support 12$. Goals are marked with green lines. final goal between 25$ and 31$. I think it has a good chart to trade. didn't grow too much in bull season.
There is also one thing I think it could happen with all coins that have only BUSD trading pair listed. they could get additional trading pair (most likely USDT), because of SEC problem with busd. So... if CREAM doesn't get delisted, it's price could bounce way above 25$.
Still... team wasn't really responsive on twitter until lately, but the recent tweet gave investors a little more hope. I think price could do at least 2x short term, if conditions are right.

CREAM trading ideaSupport at 10$ and 7$. Goals are marked with green lines. final goal 25$ (or 23$). I think it has a good chart to trade. didn't grow too much in bull season.
There is also one thing I think it could happen with all coins that have only BUSD trading pair listed. they could get additional trading pair (most likely USDT), because of SEC problem with busd. So... if CREAM doesn't get delisted, it's price could bounce way above 25$.
Still... team wasn't really responsive on twitter lately, but the recent tweet gave investors a little more hope. I think price could do at least 2x short term, if conditions are right.

CREAM - positive sentimentCould positive sentiment drive price further up, or will it drop in next few hours... next price movement is coming soon. Immediate support is at 10-11$.... First goal is 24-25$
We saw quite a volume on this coin several days ago, coin is also getting traction on social media, thanks to some crypto influencers. I am still bullish on bitcoin price (1W bullish divergence), so I can expect next bullish move from this coin. trade carefully.

CREAM BUSD TODAYLets Grab some BUSD from #CREAM.
So, let's make two entries the first one 40% at the first level, if the price drop to the lower box, let's make a second entry 60%.
The take profit levels are shown in yellow color.
No SL, for this trade. you can do your own risk management guys.
have a good day.

BREAKOUT COIN : Possiblity for breakoutThe coin is at a very important level and has a high chance of breaking out. The reason for this update is that this coin has crossed some patterns on the trading view, and as we mentioned, this coin has a high likelihood of breaking out. However, it is important to always manage your risk and remember that there are no guarantees in trading. We are sharing this coin with you because we expect it to make a new breakout view."
Between 22- 39 USD is an important and focus target.
it's a coin that shows an expected breakout.
This is not trading advice, manage your risk all time.
