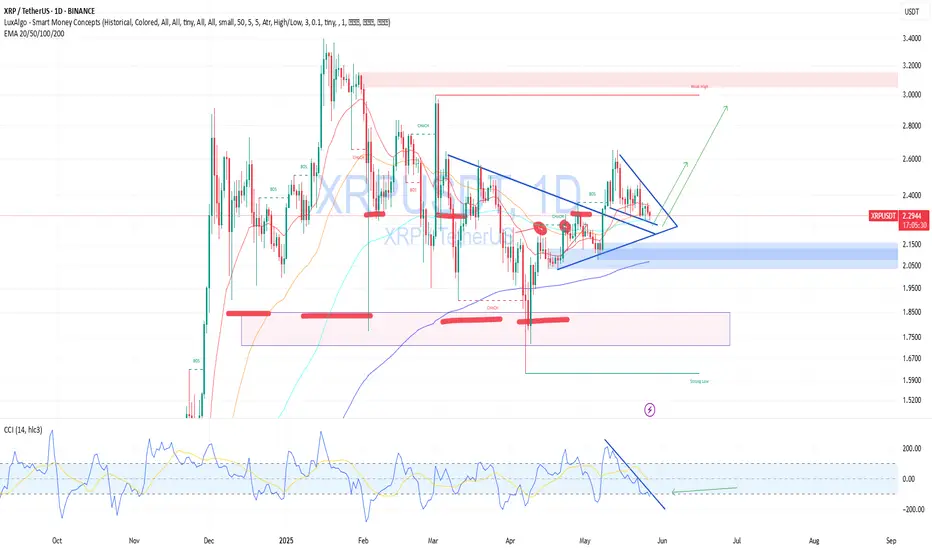
XRPUSDT — Buy From Support, Waiting for Triangle BreakoutOn the 4H chart, XRP is consolidating inside a symmetrical triangle and holding above an ascending trendline — a key support zone that has held multiple times.
🧠 Fundamentally:
Ripple continues expanding partnerships with fintech and banks.
The SEC lawsuit has lost its grip on price action.
A potential Fed rate cut could push crypto sentiment up again.
📌 I’m entering positions near $2.31, gradually accumulating. A breakout above the triangle could trigger a strong move.
🎯 Targets:
$2.50 — initial resistance
$2.65+ — if breakout is confirmed with strong momentum
🔽 If price breaks below $2.20, I’m looking to buy confidently near $1.80, where major demand sits. I don't expect such a dip, but markets can surprise.
Criptocurrency
BTCUSDTAccording to this analysis, if the price reaches around $70,000 in a corrective structure with a time-consuming and low momentum in the form of wave F, it may grow to around $120,000 and even higher in the form of wave G.
But it seems that the ideal buying point is around $60,000 and the origin of the breakout node. In this case, of course, we will have a strong wave F, which means that we must be a little flexible in the possible targets of wave G.
In terms of time, late June, July and early August are the ideal time areas for the end of wave F, and late 2025 and early 2026 are the time areas for the end of the two waves G.

SETAI - Token launched 3 days ago!!Part of the AI narrative, Setai Agents introduces an AI agent proposal designed to think and feel similarly to a human. They perceive the world around them and respond with empathy and creativity to those perceptions.
Their token launched on December 30th, and after a rise of approximately 192%, it has corrected by 45% from its peak.
For now, I foresee an upward movement in the coming days, aiming to retest that previous high and potentially reach $0.068, achieving a 90% gain on this purchase.

bullish continuationChart Summary:
Key Resistance: $101,107.27
Important Support: $98,115.68
Current Range: Between $98,000 and $100,000
📈 Current Trend:
BTC is attempting to break the resistance at $101,107.27 after a bounce from the support at $98,115.68. This move suggests a possible bullish momentum if it sustains above $100,000.
🛠️Potential Strategy:
Buy: Consider entries in the range of $99,000 - $100,000 with a stop loss below $98,000 to manage risk.
Target: Target the resistance at $101,107.27 and if broken, look towards levels above $102,000.
💡 Notes:
Trading volume and momentum indicators will be crucial to confirm the strength of the move.
Stay tuned for any news or events that may affect BTC volatility.

BTC Short for sure because of WARI think BTC goes down until the 5th of the December and all markets will be affected by the War against Iran and the US election I will invest in oil this quarter. it's just my thoughts

ETH Nears Strong Support: Strategic Buying Opportunity AwaitsBITSTAMP:ETHUSD
Current Price: 2,389.19 USDT (+0.79%)
Ethereum is currently experiencing a sideways trend throughout October, positioned near the lows of 2024. This consolidation suggests an interesting opportunity for buyers if a dip occurs toward the 2,200-2,100 USDT range.
Technical Analysis
Daily Timeframe:
The Relative Strength Index (RSI) is at 43.11, indicating a neutral sentiment.
MACD shows a bearish signal at −31.70, suggesting potential selling pressure.
Momentum is slightly positive at −211.63, signaling possible buying interest.
Moving averages are predominantly bearish, with the 10-day Exponential Moving Average (EMA) at 2,432.09 and the 20-day EMA at 2,461.91, both suggesting selling momentum.
2-Hour Timeframe:
The RSI is at 43.02, remaining neutral.
MACD also indicates a sell signal at −13.12.
The Momentum indicator is showing a slight buying signal at −42.68, hinting at potential upward movement.
30-Minute Timeframe:
The RSI remains at 43.02, with neutral readings across various oscillators.
MACD is still bearish at −13.12, indicating persistent selling pressure.
Momentum shows a slight positive value at −42.68, suggesting potential for a short-term bounce.
General Commentary on Indicators
The overall state of the indicators across multiple timeframes reflects a market that is largely in a neutral to bearish phase. While oscillators like the Momentum and Williams Percent Range are indicating some buying interest, the dominant signals from moving averages and MACD suggest that sellers are still in control. This mixed sentiment suggests that traders should exercise caution while considering new positions.
Conclusion
Given the proximity to this year's lows and the current sideways movement, it presents a favorable opportunity to evaluate a buying position if the price dips toward the 2,360-2,370 USDT range. Opening buyer positions near these lows could create an advantageous risk-reward ratio, particularly as this level aligns with strong support that has proven reliable thus far. By positioning close to solid support, traders can better manage their risk while aiming for potential gains in the event of a market rebound.
Disclaimer: This content is for informational purposes only and should not be considered as financial advice. Cryptocurrency investments carry risk, and it is essential to conduct your own research or consult with a licensed financial advisor before making any investment decisions.

BTC: What's Ahead After the CPI Data?BITSTAMP:BTCUSD Bitcoin is up 0.52%, trading at $61,317.96 after the CPI data, which slightly exceeded expectations. Despite the minor increase, the overall trend shows continued sidelined behavior, reflecting the pattern of the past months. Here's a breakdown of the technical indicators:
1D Timeframe
Oscillators: Mixed signals, with the Relative Strength Index (14) at 45.86 (neutral), but Momentum (10) and Commodity Channel Index (20) indicate buying potential. However, MACD Level signals sell.
Moving Averages: Most short- and mid-term moving averages suggest a sell, while the 200-period Simple Moving Average remains bullish at $60,020.79, suggesting long-term support.
2H Timeframe
Oscillators: Mostly neutral, but Momentum (10) gives a buy signal. The MACD Level and Moving Averages are in sell mode, reflecting short-term weakness.
Moving Averages: Clear sell signals dominate across the board, with only the Simple Moving Average (10) giving a buy at $60,868.83.
30-Minute Timeframe
Oscillators: The shorter timeframe shows mixed signals, with a buy from the MACD Level (12, 26) and Simple Moving Average (20), while Momentum (10) and Bull Bear Power remain bearish.
Moving Averages: Short-term moving averages are providing conflicting signals, showing that there may be a short-term consolidation phase.
Summary:
The indicators reflect a market still in consolidation with minor price recovery. Despite occasional buy signals on short-term charts, the overall trend remains cautious. Traders should keep an eye on potential breakouts from this sidelined range, but aggressive entries should be avoided for now.
Disclaimer: This is not financial advice. Always do your own research before making any investment decisions.

DXY doing Cycle Wave 2, now inside the Wave C about to break SupHello everyone,
In this scenario the DXY has finished the Wave Cycle Wave 1, with 5 Waves (Ending in September 2022), and now it is doing the Wave 2.
Inside the Wave 2, we encounter ourselves inside the Wave C already.
The Wave C is about to break the 100 support area, and targeting at least 92 target.
The 92 target is the minimum move that it needs to perform, since it will be the same lenght as the Wave A.
Knowing this, we expect to see other Assets rise as the Dólar falls in the upcoming months

Solana shortFrom a technical point of view, it seems that Solana is losing an important support of the Ichimoku on the 3 daily chart.
From a "fundamental" point of view, instead, it seems that the Meme narrative is cooling off on Solana, with a shy try to rotate on Tron, and amid the progressive lack of interest of the community.
So, we guess there are all the ingredients for a juicy short.

bitcoin IN A cool positionHi guys. this thing has made a nice textbook channel, today we have non farm payroll and unemployment data in the US , it can make the buttom of this wave 4 looking thing that we all suspect. but it can also chop a litle more s that it would have at least the same amount of time as of its wave 2. if bitcoin goes above 66600, you got to be bullish. but so far SPX also has shown toppy , jeff bezos sold billions of his stock. so... don't do more crazy decisions, we have all been tricked enough this year.

Bitcoin 80000 Very Soon The support of $56000 (coinciding with the 0.618 Fibonacci level) reached in April has proven to be solid and at this moment Bitcoin is aggressively attacking a dynamic resistance created by its historical high of $74000 which meets other peaks previously created around the price of $72000.
At this moment in the OrderBook there is considerable liquidity at the $72,000 level, approximately 3,000 Bitcoins. Subsequently it is possible to still notice a lot of liquidity in the immediately following levels, an indication of stop liquidity probably for Long orders.
There currently appears to be no liquidity near the all-time high of $74,000.
Personally, I remain bullish in the very short term and, as indicated by the Fibonacci extension plotted on the chart, Bitcoin's next target is $80,000

MARA looking bullish Inverted H&S with momentum coming.
Marathon Digital Holdings (NASDAQ: MARA) is currently riding a wave of bullish sentiment, propelled by several key factors that intertwine the worlds of cryptocurrency mining and market technical analysis. As a prominent player in Bitcoin mining, Marathon Digital's prospects are closely linked to the movements and milestones of Bitcoin itself.
Bitcoin's Momentum: Bitcoin's price momentum is a critical driver for Marathon Digital's bullish outlook. As the value of Bitcoin increases, so does the potential revenue for miners like Marathon Digital. This relationship is because miners earn Bitcoin as a reward for validating transactions and securing the network. When Bitcoin's price rises, the value of these rewards increases, making mining operations more profitable. Recent analyses suggest that the demand for Bitcoin is growing, which could lead to higher prices and increased mining revenue.
Approaching Bitcoin Halving: A particularly significant event for Bitcoin—and by extension, Marathon Digital—is the upcoming Bitcoin halving, expected in 2024. Halving events, which occur approximately every four years, reduce the reward for mining new blocks by 50%. While this might seem counterintuitive as a bullish signal, halvings have historically led to price increases in the months following the event. This is partly because the reduced supply of new Bitcoins coming into circulation can lead to scarcity, pushing prices up if demand remains steady or increases. Marathon Digital is well-positioned to benefit from this, especially given its efforts to expand mining capacity and cut costs, thereby potentially maximizing profits during and after the halving.
Inverted Head and Shoulders Pattern: From a technical analysis perspective, an inverted head and shoulders pattern observed in Marathon Digital's stock chart adds another layer of bullish sentiment. This pattern is often interpreted as a reversal pattern that signals the end of a downtrend and the beginning of an uptrend. For investors and traders who follow technical analysis, such patterns can serve as a buy signal, leading to increased buying pressure and potentially higher stock prices.
Marathon Digital's strategic moves to double its mining capacity and reduce operational costs by 30%, in preparation for the 2024 halving, align with these bullish indicators. Together, Bitcoin's current momentum, the anticipation around the halving event, and positive technical analysis patterns like the inverted head and shoulders create a compelling case for optimism around Marathon Digital Holdings.
In conclusion, multiple factors contribute to a bullish outlook for Marathon Digital Holdings. The company's fortunes are closely tied to those of Bitcoin, and with positive momentum in the cryptocurrency space, an approaching halving event that could reduce supply while demand remains strong, and favorable patterns in technical analysis, there's a solid foundation for bullish sentiment among investors and analysts alike.
Targets: 48, then 64 and beyond

BTC - Weekly Perspective - 02/11 to 02/18As stated in previous analyses, the long-term chart showed an upward pivot, in which the 44.96K region was an important resistance point to be overcome in this chart time.
Anyway, this value was left behind, and the crypto needs to reach the 51.4K region and remain above 44.9K throughout this month to remain in a consolidated upward trend and seek the top region at 65.1K. See the image below
If this does not happen, we can characterize this breakout of strong resistance as just a beautiful buying "TRAP" and have the following situation. See the image below.
On the short-term chart we have a pattern that could help the crypto reach the level of 51.4k.
Do your analysis and good business.
Be aware, if you buy, use stop loss.
See other graphical analyzes belo

MATIC COIN I have been waiting for a chance to buy for a long time and now with the price reaching the bottom of my channel, it seems like a good time to buy to reach a new price.

Rising Wedge on FitfiFitfi in 4hr time frame is creating a rising wedge pattern, i think we will see the price around 0.0036 - 0.0033 usdt

SHORT - Bitcoin, medium-term projectionAccording to my technical analysis, a correction in Bitcoin prices should begin to be generated, it has generated the 5 Elliot waves, it has respected the fractals, it has generated a double top and it is at a 52-week high, so which the greatest probability is that it will fall between 38% and 50% according to the Fibonacci retracements to continue with the upward trend. What do you think?

UPDATE Analisis BTCUSDTFor the moment my previous analysis is correct, now I'm waiting for a retracement in the 30,000 area which should then lead the price to rise again

Analisis BTCUSDT for next month (June 2023)In my vision, BTCUSDT could be suffer a retracement in 24000.00 / 25000.00 zone before resume in Bull Market!

stonks meme coin. cup & handle patternthis is a new coin, only two weeks old. but right now is looking like forming a cup and handle pattern. this is just an idea, because it is a meme coin, so i dont expect this pattern to play out. if it did, we are looking around 600% pump if break the resistance line (pink line)

BTC looking for wave 4 complex?Hello everyone, after a sequence of isolated waves, the pullback was not enough to guarantee a true wave 4, therefore, will we be in a complex wave 4 and then look for a new low?
== Spanish ==
Hola a todos, luego de una secuencia de ondas isoladas, el pullback no fue suficiente para garantizar una verdadera onda 4, por lo tanto, estaremos en una onda 4 compleja para luego buscar un nuevo minimo?

BNB - LONGJust created a trend zone with support and resistance zones , im not giving you signals with where and when to Buy or sell.
You have all prepared, so just make it simple and follow the trend or wait for a breakout.

#ETHUSDT Trading plan!Hello friends!
In this idea, I describe the reasons for considering trading in one direction or another based on the following criteria:
Resistance level - reversal;
There is energy accumulation before the level for a breakout;
Prolonged accumulation in a sideways channel;
Closing below the level (a good signal);
Parabolic energy accumulation before the level;
No reaction to a false breakout.
It's no secret that the markets reacted in the past week to the bankruptcy of a bank, and the Federal Reserve System
turned on the printing press once again. Against this backdrop, the markets began to grow, as they did during the COVID-19
pandemic. Don't forget that tomorrow there is news from the Federal Reserve regarding further interest rate changes, which
could affect market reactions.
Given the reasons outlined above, I expect the coin to grow in the near future. I plan to buy on a breakout above the level of $1,800.00.
Target #1: $2,020.00
Target #2: $2,161.00
Target #3: $2,446.00 in the best-case scenario.
Despite all the targets, I will close the deal at any time if I am not satisfied with the market.
Be careful, the market is currently very unstable, so enter only at strong levels and with stop-loss orders!!!
Wishing you all profitable trades!

Dogecoin trendline, key levelsI expect the DOGE to follow the trend line to the next resistances, after it breaks the secondary trend line.
D1:
