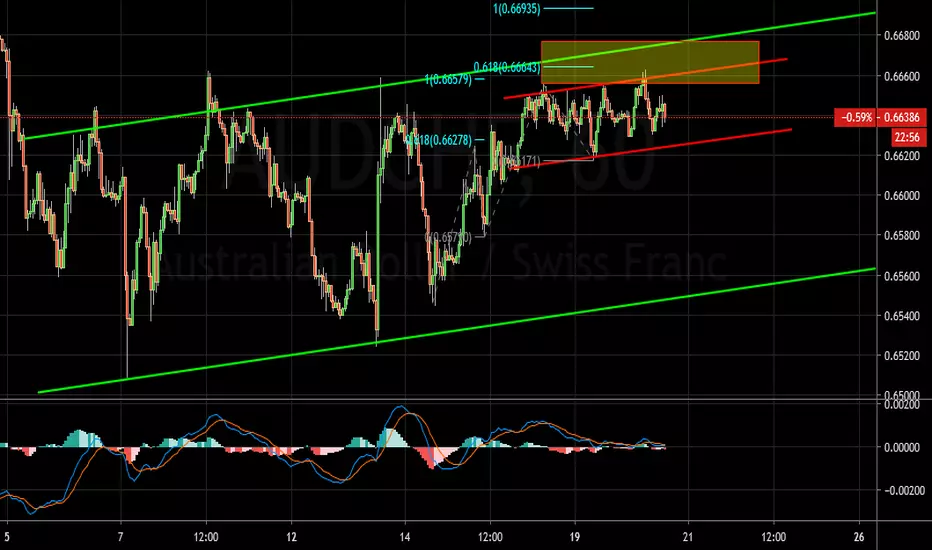
AUDCHF Buy IdeaH4 - Price is moving inside a channel and is currently nearing the bottom of it. Bullish hidden divergence.
H1 - We have a critical zone formed by the fibo level of the cycle and the bottom of the H4 channel, price is nearing this critical zone, bullish divergence.
Once the price reaches this critical zone we may then start looking for bullish setups with more bullish evidences in order to join the bulls.
Criticalzone

EURUSD Short Term Sell IdeaD1 - Price is holding below a resistance zone.
Until this zone holds, we may look for bearish evidences on lower timeframes in order to start looking for the sells.
H4 - We have a critical zone that has formed.
We may now expect one more push higher from the current zone towards this critical zone.
We may then start looking for bearish setups with bearish evidences in order to join the bears.

US 30 Two Roads Diverge in Woods: Which Path?Chart shows all. Got a channel with pennant forming near bottom TL. Approaching tip of pennant, must break one way.
If break is up, can go to 29K by Jan 2020. If down... bottomless pit. Foolish optimism on trade driving another huge gap; is it an Exhaustion Gap? Or Gap & Go?
If Initiation Gap, then we gonna get a breakout; but all gaps fill eventually. R/R so terribad atm, IMO best position is sitting out.
Not losing is way more important than possibly winning; preserve your capital! Fake 'Opportunities' lost are nothing lost.
This isn't advice; trade at your own risk: GLTA!

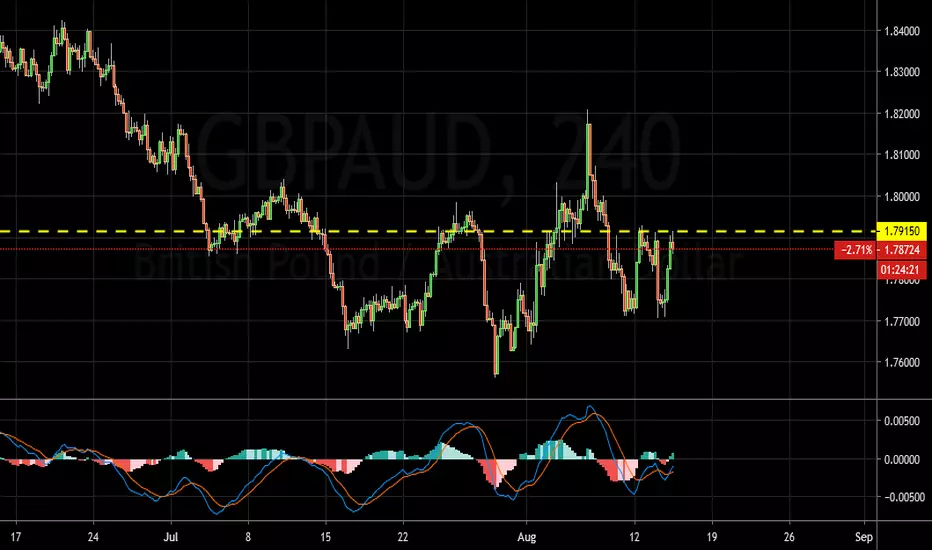
GBPAUD Buy IdeaD1 - 3 higher highs, higher lows structure, currently it looks like a retrace is happening. Price is nearing the uptrend line, bullish hidden divergence.
H4 - Price has reached a critical zone formed by the fibo level of the cycle and the daily uptrend line, potential bullish divergence.
H1 - Potential bullish divergence, until this critical zone holds we may look for bullish setups with bullish evidences in order to join the bulls.

Silver Sell IdeaH4 - Price has currently reached the downtrend line, bearish divergence.
H1 - Price has reached a critical zone formed by the fibo level of the cycle and the downtrend line.
Until this critical zone holds we may look for bearish setups with bearish evidences in order to start looking for the sells.

NZDUSD Buy IdeaW1 - Special cycle, price reached a critical zone, bullish divergence. Until this critical zone holds we may look for retraces to happen.
D1 - Bullish divergence, price broke above the most recent downtrend line.
H4 - Price is moving inside a triangle pattern, if we get a valid breakout above this pattern, we may then start looking for buys with bullish evidences.

EURCAD Buy IdeaW1 - Price reached a critical zone, bullish divergence.
D1 - Bullish divergence, price broke above the most recent downtrend line.
H4 - 3 higher highs, higher lows structure, if we get a valid breakout above the triangle pattern, we may then start looking for buys with more bullish evidences.

AUDJPY Sell IdeaH4 - We have a critical zone that has formed by the fibo levels of the cycles and the downtrend line.
H1 - Price reached the bottom of the triangle pattern, if we get a valid breakout below this pattern, we may then start looking for sells with bearish evidences.
Alternatively if the price moves higher then the next area to look for sells with bearish evidences would be the critical zone.

Gold Sell IdeaH4 - Hidden bearish divergence right at the retest of the broken neckline of the head and shoulders pattern.
H1 - Price has reached a critical zone, potential bearish divergence.
We may now look for bearish setups with more bearish evidences in order to join the bears.

EURCAD Buy ideaW1 - Price reached a critical zone formed by the fibo level of the cycle and the psychological area 1.44. Bullish divergence.
H4 - Bullish divergence.
H1 - Bullish divergence, if we get a valid breakout above the downtrend line we may then start looking for buys with more bullish evidences.
if you want to be more conservative then wait for the price to break above the high shown in the screenshot, we may then start looking for buys with more bullish evidences.

EURAUD Sell IdeaD1 - Price is currently below the middle of the channel, price still has room lower towards the bottom of the channel.
H4 - Double wave down, currently it looks like a retrace is happening towards the 38.2% fibo retrace zone.
H1 - Price has reached the first critical zone, bearish divergence. Until this critical zone holds we may look for bearish setups with bearish evidences in order to join the bears.
If the price moves higher then the next area to look for bearish setups with bearish evidences in order to join the bears would be the second critical zone.

USDCHF Sell IdeaD1 - Price reached the top of the channel.
H4 - Price reached a critical zone formed by the top of the daily channel and the fibo levels of the cycles, double top, bearish divergence.
H1 - Bearish divergence, price has broken below the uptrend line, we may now look for pullbacks and sells with bearish evidences,

CADCHF Sell IdeaD1 - Potential double wave down, price has room lower towards the critical level. Price is currently moving inside a bearish flag pattern.
H4 - We have a critical zone that has formed based on the fibo levels of the cycles and the top of the daily bearish flag pattern.
Price has currently reached this zone, we have potential bearish divergence,
We may now look for more bearish evidences in order to join the bears.
Invalidation: If the price breaks and holds above the H4 critical zone then this sell setup will be invalidated (false breaks can be neglected).

Dax Sell IdeaD1 - Potential double wave down, price has room lower towards the critical level.
H4 - Special cycle completed, currently a retrace is happening, double wave up price has reached a critical zone formed by the 100 fibo expansion level and 61.8 fibo retrace level.
Potential bearish divergence. Until this level holds we may look for bearish setups with bearish evidences in order to join the bears.Price
H1 - Price has reached a critical level formed by the fibo levels of the cycle. This critical level coincides with the H4 critical zone. Bearish divergence.
Invalidation: If the price breaks and holds above the H4 critical zone then this sell setup will be invalidated (false breaks can be neglected).

AUDCHF Sell IdeaD1 - Price is moving inside a bearish flag pattern.
H4 - Price is nearing the critical zone formed by the top of the daily bearish flag pattern and the fibo level of the cycle.
H1 - Bearish divergence, once the price reaches the critical zone, we may then look for bearish setups with bearish evidences in order to join the bears.
Invalidation: This sell setup is valid until the critical zone holds. If the price breaks and holds above the critical zone then this sell setup will be invalidated.

USDCAD Sell IdeaW1 - Price broke below the bottom of the channel. Currently it looks like a pullback is happening.
D1 - Bearish hidden divergence.
H4 - Potential triple or special cycle forming. Currently the last leg is developing,
We also have a critical zone that has formed based on the bottom of the W1 channel and the fibo levels of the cycles.
We may now expect one more push higher with the price reaching the critical zone, we may then start looking for sells with more bearish evidences.

AUDCHF Sell IdeaD1 - Price has created lower lows currently it looks like a flat correction is happening.
H4 - Price is moving inside a bearish flag pattern.
H1 - Price is moving inside a small range, price has reached a critical zone formed by the top of the H1 range, H4 bearish flag and the fibo levels of the cycles we have and is currently moving lower.
Until the price holds below the critical zone we may look for bearish setups with bearish evidences in order to join the bears.
GBPAUD Buy IdeaW1 - Price reached the bottom of the channel.
D1 - Price is holding above the critical zone formed by the bottom of the weekly channel and the fibo level of the cycle.
H4 - Double bottom, if the price breaks and holds above the high shown in the chart, we may then start looking for buys with more bullish evidences.
AUDCAD Buy IdeaD1 - Triple cycle down, price reached a critical zone, potential bullish divergence.
H1 - Triple cycle down, price reached the critical zone and is moving higher, bullish divergence.
If the price moves higher and breaks above the high shown in the chart we may then look for pullbacks and buys with more bullish evidences.
Invalidation: This buy setup is valid until the low shown in the chart holds.

USDCHF Sell IdeaW1 - Price broke below the triangle pattern currently it looks like a pullback is happening.
D1 - Bearish divergence.
H4 - Price reached a critical zone formed by the fibo levels of the cycles and the bottom of the weekly triangle pattern, bearish divergence.
We may now look for more evidences of bearish pressure in order to join the bears.

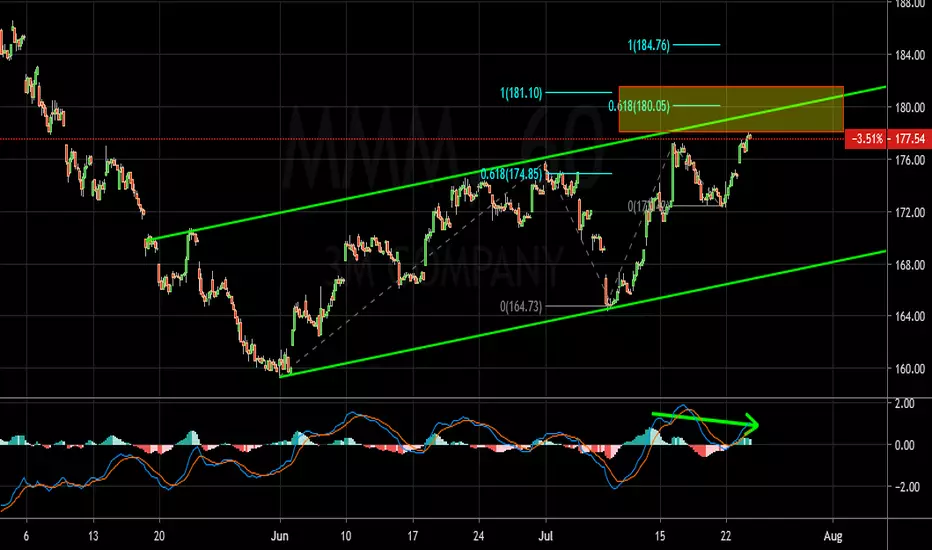
3M Sell IdeaD1 - Price has reached the top of the bearish flag, bearish divergence.
H4 - Bearish divergence.
H1 - Price has reached the critical zone formed by the top of the daily bearish flag pattern and the the fibo levels of the cycles. Bearish divergence.
Until this critical zone holds, we may look for more evidences of bearish pressure in order to join the bears.
EURJPY Buy IdeaD1 - Price has reached the bottom of the channel.
H4 - Price has reached the critical zone that has formed based on the fibo levels of the cycles and the bottom of the daily channel and is currently moving higher. Bullish divergence.
Until the critical zone holds, we may look for short term buys with more bullish evidences.
Invalidation: If the price breaks below this critical zone then this buy setup will be invalidated.

NZDCHF Buy IdeaD1 - Bullish convergence, currently it looks like a pullback is happening.
H4 - Five leg structure, price reached a critical zone formed by the 50% retrace and the fibo expansion level of the cycle and is currently moving higher.
Price broke above the downtrend line, we may now start looking for buys with more bullish evidences.
