CRM potential growth back to 270Retraced back from 270-280 levels. Could be a retest, after which it could go back up.
Entry level - above 255
Target level - 270
Stop-loss - 249
Size - 5% of the capital
Period 4-6 weeks
CRM

Sales Force : Signal confirmed to BuyThe break of 257 (Kijun) perfect signal to continue the bullish trend and perfect moment to buy.
next target after the break of the last high :281, 291 and 304


The Magical 50 days Exponential Moving Average (50EMA)In 2021, we should take the price reaction to 50EMA very seriously! Especially if you like to buy the dips!
I believe it could be single best tool to help you find the best entry and exit point in many tickers..!
Let's review few examples:
1- NASDAQ:NVDA
2- NASDAQ:MSFT
3- NASDAQ:AAPL
4- NASDAQ:GOOG
5- NASDAQ:FB
6- NYSE:CRM
7- NASDAQ:CSCO
8- NYSE:SNOW
9- NYSE:BAC
10- NYSE:XOM
and major indexes:
SP:SPX
TVC:NDX
TVC:DJI
What is Price Action?
Price action is the movement of a security's price plotted over time. Price action forms the basis for all technical analysis of a stock, commodity, or other asset charts. Many short-term traders rely exclusively on price action and the formations and trends extrapolated from it to make trading decisions. Technical analysis as a practice is a derivative of price action since it uses past prices in calculations that can then be used to inform trading decisions.
Price action generally refers to the up and down movement of a security's price when it is plotted over time.
Different looks can be applied to a chart to make trends in price action more obvious for traders.
Technical analysis formations and chart patterns are derived from price action. Technical analysis tools like moving averages are calculated from price action and projected into the future to inform trades.
How to Use Price Action
Price action is not generally seen as a trading tool like an indicator, but rather the data source off which all the tools are built. Swing traders and trend traders tend to work most closely with price action, eschewing any fundamental analysis in favor of focusing solely on support and resistance levels to predict breakouts and consolidation. Even these traders must pay some attention to additional factors beyond the current price, as the volume of trading and the time periods being used to establish levels all have an impact on the likelihood of their interpretations being accurate.
Limitations of Price Action
Interpreting price action is very subjective. It's common for two traders to arrive at different conclusions when analyzing the same price action. One trader may see a bearish downtrend and another might believe that the price action shows a potential near-term turnaround. Of course, the time period being used also has a huge influence on what traders see as a stock can have many intraday downtrends while maintaining a month-over-month uptrend. The important thing to remember is that trading predictions made using price action on any time scale are speculative. The more tools you can apply to your trading prediction to confirm it, the better. In the end, however, the past price action of a security is no guarantee of future price action. High probability trades are still speculative trades, which means traders take on the risks to get access to the potential rewards.
Conclusion:
Monitor asset reaction to 50EMA and define your entry and exit strategy based on this simple tool!
Reference Article::
www.investopedia.com

CRM Daily TimeframeSNIPER STRATEGY (new version)
It works ALMOST ON ANY CHART.
It produces Weak, Medium and Strong signals based on consisting elements.
NOT ALL TARGETS CAN BE ACHIEVED, let's make that clear.
TARGETS OR ENTRY PRICES ARE STRONG SUPPORT AND RESISTANCE LEVELS.
ENTRY PRICE BLACK COLOR
TARGETS GREEN COLOR
STOP LOSS RED COLOR
DO NOT USE THIS STROTEGY FOR LEVERAGED TRADING.
It will not give you the whole wave like any other strategy out there but it will give you a huge part of the wave.
The BEST TIMEFRAMES for this strategy are Daily, Weekly and Monthly however it can work on any timeframe.
Consider those points and you will have a huge advantage in the market.
There is a lot more about this strategy.
It can predict possible target and also give you almost exact buy or sell time on the spot.
I am developing it even more so stay tuned and start to follow me for more signals and forecasts.
START BELIEVING AND GOOD LUCK
HADIMOZAYAN

Salesforce - Wait for a good Entrance!-SalesForce, a great company to buy. Currently is going through a bearish run which will possibly end after another 1-2% drop.
-We are waiting for it to find the support at which level we are planning to enter to our position with CRM.
-Possible support is expected to come at around $260-$261.

PLAN - Bullish call flow Aug 27thAnaplan, Inc. is a cloud-native enterprise SaaS company that helps improves business performance. Options - Over 3800 Sept $70 calls bought Aug 27th, Put/Call ratio is .21. Related tech business software names that did well for earnings, TEAM, MNDY, CRM, BILL. Currently above the 200 SMA, $61.8.

CRM Bearflagging after rejection at top of channel Will likely pullback to 260 next week.
(Not advice, opinion only).

Salesforce Analysis 24.08.2021Hello Traders,
welcome to this free and educational analysis.
I am going to explain where I think this asset is going to go over the next days/weeks and where I would look for trading opportunities.
If you have any questions or suggestions which asset I should analyse tomorrow, please leave a comment below.
I would also appreciate, if you would smash that like button and help me to create more free analysis like that.
Thank you for watching and I will see you tomorrow!

CRM active setup. Let's see how this performsToday we will talk about CRM. Here we have an active setup, and we will explain why we decided to develop it this way.
Main structure: The most important aspect of the chart before the entry was executed, was this huge Flag pattern above a dynamic support resistance level. We were waiting for a breakout of the structure before developing setups. Also, we could observe 0 resistance levels after that.
Time Horizon: When you are trading a big structure, you must understand that these types of setups take a lot of time to evolve. However, that's not a problem if you know how to handle your anxiety and have other setups or strategies running with this.
The target: Is a convergence between fibo extensions and an ascending channel that is not defined yet (we need a new ATH to confirm it. However, if that happens, the alignment is pretty good.
Activation Level: Our entry price is always above minor resistance zones of the corrective pattern, or in other words, "Always above B." That way, we avoid a lot of fakeouts.
Invalidation Level: IF everything goes wrong, the invalidation level we have is below the structure. There we will automatically close our setup losing 1.5% of our Capital.
Thanks for reading!

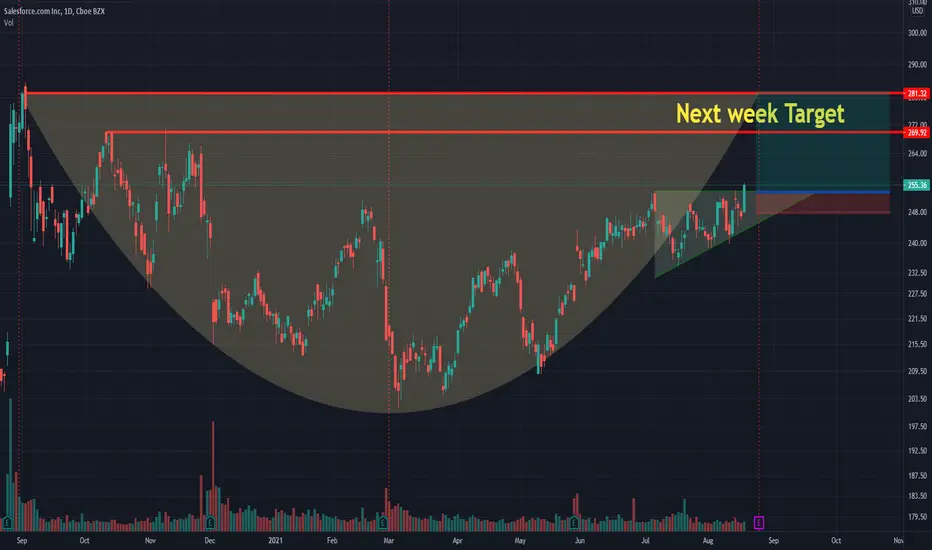
Next week targetEntry: 253-255
Stop loss: 244
Reward/Risk:5
Target range: 280-300
Time Frame: 1-2wks
Possible gain: 11.2(20% for second target)
Possible loss: 2.2%
CRM: Could be breaking out of the consolidation soon!Price broke out of a down channel back in beginning of May, and it went into a consolidation for coming to 2 months.
CRM will be reporting their Earnings on 25th, and price could gap up.
Stop loss can be placed below $237 .
Target will be at $270.
Disclaimer: I'm not giving any trading and investing advice. I'm just sharing my chart observations.
If you have any symbols that you'd like me to analyze, feel free to drop me a comment.


$CRM Salesforce bullishIf NYSE:CRM surpaces the $250 dollars in the next days and keeps over this amount it would increase between 9% and 20% form its current price

Trade Idea on CRM - Trading the Flag PatternHi! Today we will share with you a trade idea (real setup we will execute on CRM)
First, let's understand what we can see here from a technical perspective.
a) The price was inside an expanding structure defined by the dynamic support-resistance trendline (white line) and the support level.
b) After a huge GAP that broke the expanding structure, we observed a 270 days consolidation (Flag Pattern).
c) In June, we saw the breakout of the Flag Pattern that tends to anticipate the beginning of a new movement once the price reaches a specific confirmation level (ABOVE "B")
d) Based on the previous items, we have defined pending orders above "B" and stop loss below "C" the key idea of these levels is that they are on price levels that provide good confirmations in term of broken levels. This type of approach increases the possibility of success.
e) What about the target? We have used a principle developed by Elliott, "New Impulses have correlations with the previous ones." In this case, using the previous impulse (Before the Flag Pattern), we can draw Fibonacci Extensions (nothing more than fixed proportions) to define 2 targets.
f) How long can it take this movement if everything goes as expected? Between 200 and 350 days.
g) How much do you risk in a setup like this? ALWAYS 1% OF our capital, never more. What does it mean? If you have a 10.000USD balance, you want to have a maximum loss of 100USD if the price reaches the stop loss.
Is this a forecast? Not at all; this is a scenario that our system tells us, "Here you have a 50% chance of having a winning setup, with a risk-reward ratio of 2.36" With that clear, this is a bet we will take 100 times. The most probable thing is that we will be wrong 50 times and right other 50. Our main goal is developing a positive expectancy over the long term. In other words, "an edge."
Thanks for reading!

CRM MONSTER MOVE COMING!!!-We successfully closed above the 9-day ema and had a little pullback
- Now we have a clear pathway towards next level of resistance we can take a position here on monday once we see a clear trend starting to form
-you can also wait till we break that resistance level then take a safer position.
-Once we break levels there then we are gonna be sitting in deep profit already and this can go back to ATH from here.

Sunday Prep 7/19 - $CRM Looking for a flush into the 200d/monthly pivot/quarterly pivot in the 233 area for a high probability spot for a bounce. Added bonus is that level is ALSO the 20sma on the weekly. I will also be starting a swing long down in that area in my longer term account. But will just nibble for now due to the early comments mentioned about the broader market.

Is it a good time to open long positions in Salesforce???IMO: for a better entry wait for it to close above the resistance level and gets out of he consolidation pattern..!

CRM - Time for Calls!After a successful acquisition of #Slack by July 31st (per their regulatory filing ), #CRM is poised to return to previous resistance levels.
I like ~ $261 (R1) as the next clear direction for the stock. If broken, watch for a return to ~ $270 (R2) as well.
With data provided by MarketBeat.com , the average consensus price target from analysts is $278.65, indicating a possible short-term upside of 12.27%.

crm break out over 248 Set stop to entry after getting filled. has a good r/r target around 251 . wont buy until over 248

Salesforce - Strong Buy!-Salesforce's (NYSE:CRM) stock recently popped after the cloud services company posted its earnings report for the first quarter of fiscal 2022. Its revenue rose 23% year-over-year to $5.96 billion, beating estimates by $70 million, and grew 20% on a constant currency basis.
-Its non-GAAP earnings increased 73% to $1.21 per share, which cleared expectations by $0.33, as its GAAP earnings more than quadrupled to $0.50 per share. Gains from its strategic investments boosted its non-GAAP and GAAP earnings by $0.24 and $0.23 per share, respectively.
-Salesforce's revenue growth accelerated from its 20% growth in the fourth quarter of fiscal 2021. It also surpassed its own guidance for about 21% growth, which had already been raised in the fourth quarter. Its revenue increased by the double digits across all four of its core businesses.
-Salesforce's operating cash flow jumped 76% year-over-year to $3.2 billion during the first quarter, while its free cash flow soared 99% to $3.1 billion. It usually generates its strongest cash flow growth in the fourth and first quarters, since that's when it usually collects its annual fees.
-Nonetheless, Salesforce's year-over-year growth remains robust, and indicates it can still easily fund new investments and acquisitions. Its cash, cash equivalents, and marketable securities climbed 53% year-over-year to $15 billion during the quarter.

CRM potential to 240-250 after ERCRM has been trading in a descending price channel for a while now. Expecting strong quarterly report in May and price rising to 240-250.

