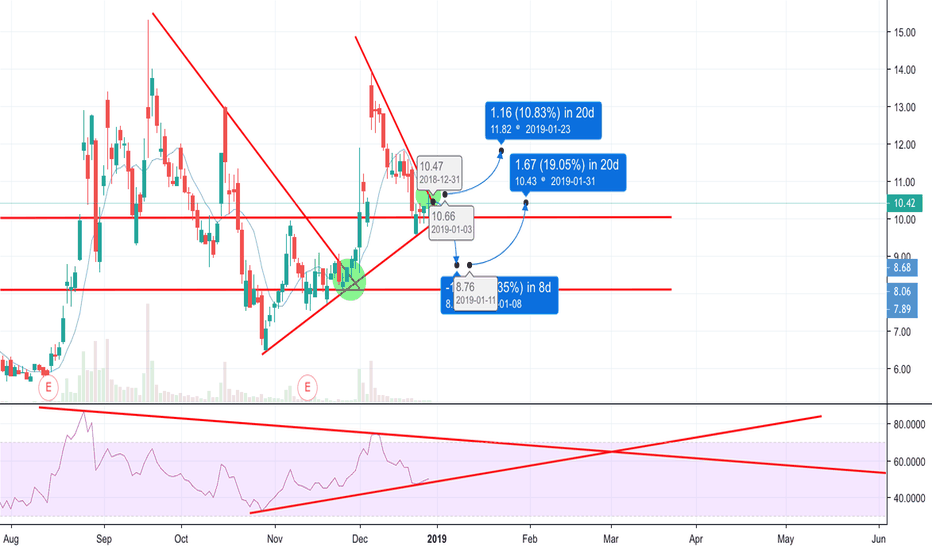
Mid-Term Prospects for POT EFT MJWeed is the future, or so they say. 2018 saw a ton of overweight equities, but they have proven to be some of the most resistant names in today's market. Therefore, it stands to reason that if names like CGC, TLRY, and CRON will continue their rise, this ETF will reflect that success. It needs to retract, but will offer a great buying opportunity in the next 1-2 weeks.
CRON
Looking GREAT!!I have multiple wave counts going here right now, but all of them look like we have plenty of room to go up!
Might get a small pullback to $16, but honestly I'm going in now around 18 just in case. If it goes down to 16, I'll just buy more to get my average share cost down. That hemp bill and the new congress means good things for cannabis.
Climax Top. Entry 1/4 Position TomorrowMarket Cap
2.86B
Enterprise Value
1.94B
Price/Sales
484.27
I think it is getting a little too far ahead of itself at this point. The Cramer pump is suspicious, especially considering the timing.
The reason I'm only adding 1/4th is because the momentum is still strong, and it could rally up to $20.00.
CRONOS GROUP, CRON, Bull Run Once Support Has Been Tested!Self explanatory chart....Bull Run coming with three possible upward movements at key support levels which can be supported by the 50, 100, and 200 day EMA's ranging from the next week to next month. Win, win, and win situation!
Get into the Canadian Weed market now while the U.S. market tanks in 2019.
CRON, Medium, 8 - 16 January Support and 5th Wave Confirmation!I looked once last time after utilizing the 50, 100, and 200 moving averages and adding a massive Elliot wave that encompasses months worth of price movement. The good news is that no matter how you look at it, this stock is bouncing predictably off of the upper and lower price channel and showing a general positive movement. Those 50,100, and 200 EMA's along with the historical support levels all line up to show that we are nearing the bottom of our consolidation and that the green or blue wave (4) patterns and subsequent (5) are the likely scenario during the month of January. We'll know by mid-month!
G'luck!
CRONOS, Medium, Key Support Levels Support A Bull Run!Pretty self explanatory chart....we are approaching our first key support level...if we break below it then the 2nd scenario would play out, etc.
Yes, in every scenario it is a Win, Win. Stay in the Canadian Weed Market. If you aren't in it yet, GET IN!
The majority of U.S. stocks will be impacted over the entire 2019 during the massive upcoming DJIA correction.
NBEV - Short-term LONGI am bullish on NBEV, price is in a parallel channel going up. The lower end of the channel corresponds to the 61.8% Fibonnaci level on a longer time-frame. If price also breaks out of the big triangle pattern, it'll be a very good opportunity for a longer long!
Trade safe!
If you feel like tipping :) www.paypal.me
Cron may be starting long descent.Slightly overbought on the Daily and near the top of the channel. CRON is getting ready for a large pullback.
I will be looking to buy in the $12 range which would start forming a nice equalizing pattern, though it will largely depend on what the indicators look like at that time.
CRON - Head and Shoulders or Fibonacci Retrace?Everyone can see the Short Term Head and Shoulders Pattern, starting in August until now. A peak of $13.44, a push to $15.30, and losing steam rolled up to $13.00 before tanking. But let's say this H&S pattern was correctly called. Now what?
We take previously charted trendlines, which are still unbroken. The bullish market for this stock continues long term, despite short term losses erasing gains. The H&S pattern dictates a potential loss equal to the vertical distance of the neckline and the head. Some have charted this around a $5.00 vertical, starting at $8.72. This should put us down to $3.72 area.
However, if we draw a Fibonacci Retrace, since inception, we see a 61.8% Fib level which remains unbroken, at $5.96. I expect strong resistance at this level, despite the potential short term Head and Shoulders Pattern. As the market continues to be oversold, look for a bullish divergence to appear. My opinion, which is strictly my own, is that this stock becomes a good buy between $5.50-$6.00.
Take a look at the past. Draw a quick Fibonacci chart for the first great gain. What does it do? It retraces all the way back to the 61.8%, just as it is currently. Afterwards, it skyrockets back up to the 88% Fibonacci Extension level, and starts consolidating for the next move.
This will reverse and bounce, and either retrace back to the original neckline before coming back down, or will rocket past and upwards to the 88%, 100% level.
Cronos relative potentialCronos market cap. 1.2B vs Canopy Growth market cap. 7.8B and Tilray market cap. 8.4B
Has relative potential to grow in comparison with Canopy Growth and Tilray.
Long term idea without predefined stop loss and target profit.
Disclaimer: not investment advice, not qualified licensed investment advisor, author may have positions in mentioned assets.


