Cronos 2025/26 New All-Time High Revealed · PP: 1,140%Cronos has all the classic signals ready, confirmed and combined. RCC. And this opens the doors for a major advance which will not be shown fully on this chart. That is because I am using the linear chart for perspective but the log chart is needed to see all the major targets. Just trust, it is going to move very high in this bullish cycle run.
Good afternoon my fellow Cryptocurrency trader, I hope you are having a wonderful day.
Didn't I told you that you would see so much growth, that you will become complacent at some point? We are not there yet, but we will get there and you will have new challenges to face. Believe it or not, taking profits, using your earnings, will be one of the hardest things to do but the only right choice. A win is only a win when you close when prices are up.
Just as you cannot incur a loss unless you sell when prices are down; you cannot secure a win unless you sell when prices are up. When a pair grows 1,000%, you should take profits, period. When a pair growths 500%, it is wise to secure, 10%, 20%, etc. A plan is needed to achieve maximum success.
How you approach the market will depend on your goals, your capital, your trading style, which projects are available to you in your home-country, and so on.
A long-term investor does not need to sell, can continue to buy, accumulate and hold for a decade or more. Can you see? Each strategy is dependent on the person behind it.
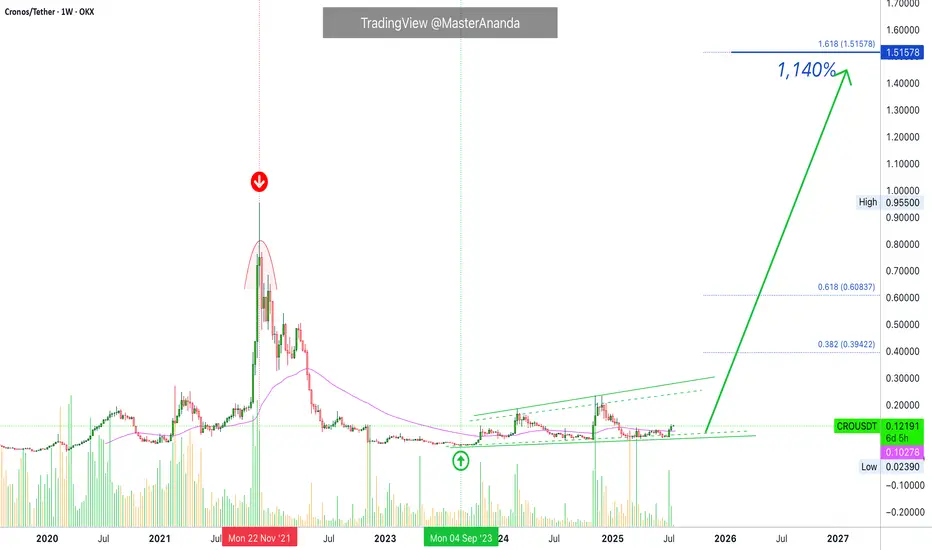
CROUSDT · Trading weekly above EMA55 while still near the bottom. The bottom is revealed when we compare current candles size and location to the 2021 high price.
Last but not least, notice how each time there is a strong increase in trading volume the weekly session ends up closing green. Bullish volume is dominating this chart. A long-term accumulation phase.
Without further ado, the next and easy all-time high target is $1.51 but it can go much higher. Total profits reaching 1,140%.
Thank you for reading.
Namaste.
Cronos
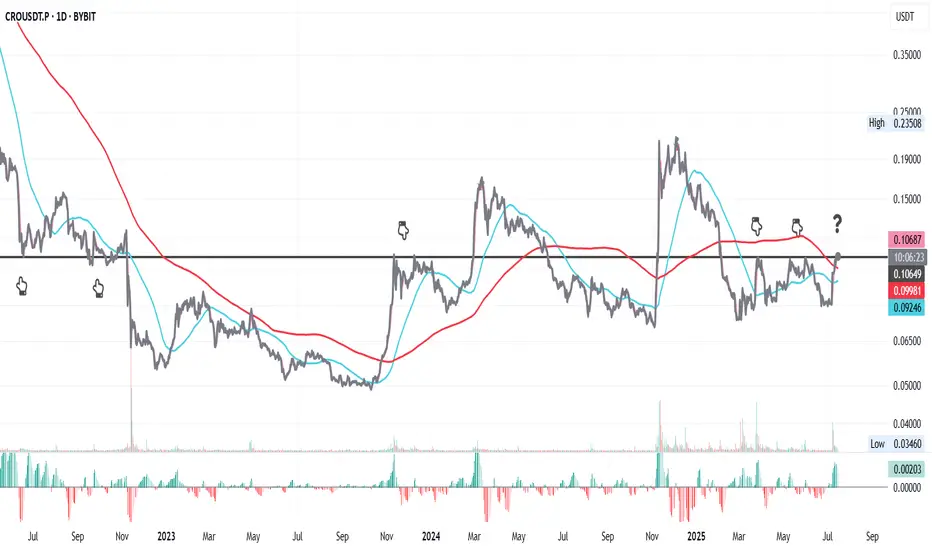
CRO at a Turning Point ?This is CRO on the daily chart.
Price has interacted multiple times with the key resistance at **0.10649** (black line). It’s now testing that level again, and there's a real possibility it flips it into support.
On top of that, CRO is attempting to reclaim the 200MA, while the 50MA is starting to flatten out—potential signs of a longer-term shift.
That said, this process might take some time and could be volatile. CRO’s relatively small market cap of \$3.33B and this week’s major macro events (starting today with CPI) could add pressure in both directions.
Always take profits and manage risk.
Interaction is welcome.
Cronos Rallies 18% After Truth Social Files for Blue-Chip ETFOKX:CROUSDT is a leading candidate for a Binance listing this month, following the proposed Crypto Blue-Chip ETF filed by Truth Social with the SEC. The fund includes 70% Bitcoin, 15% Ethereum, 8% Solana, 5% Cronos, and 2% XRP , positioning Cronos as a key asset in the fund.
Of the tokens in the proposed fund, only Cronos (CRO) is not currently listed on Binance. If the SEC approves the Crypto Blue-Chip ETF, Binance could fast-track the listing of Cronos . This move would likely draw more liquidity and investor interest toward CRO, fueling its price growth.
OKX:CROUSDT price surged by 17.8% over the last 24 hours, signaling strong momentum. If the ETF listing is approved and Binance acts swiftly, CRO could break through key resistance levels, potentially surpassing $0.1007. This upward movement would benefit investors, continuing the positive trend for the altcoin.
Cronos (CRO) Soars +20% – Can the Rally Push to $0.10?Over the past 24 hours , the Cronos project with the CRO ( COINBASE:CROUSD ) token has seen a price increase of nearly +20% .
Let's see if we can still profit from the movement of the CRO token .
What is Cronos (CRO)?
Cronos is an EVM-compatible blockchain built on the Cosmos SDK. It supports DeFi, NFTs, faster payments, and even AI‑capable dApps. Its native token, CRO, powers fees, staking, and ecosystem activities.
Why CRO Jumped +20% Today (July 8)
Technical leap: Sub-second block times and faster throughput
Better UX: Real-world ready for fast DeFi, payments, and AI dApps
Increased adoption: Greater utility across CAPITALCOM:CROUSD ecosystem
Trader momentum: Volume surges and speculative interest
Strategic roadmap alignment: Upgrades following gas fee improvements ---------------------------------------------------------------------
Now let's examine the CRO token chart on the 4-hour time frame from a technical analysis perspective.
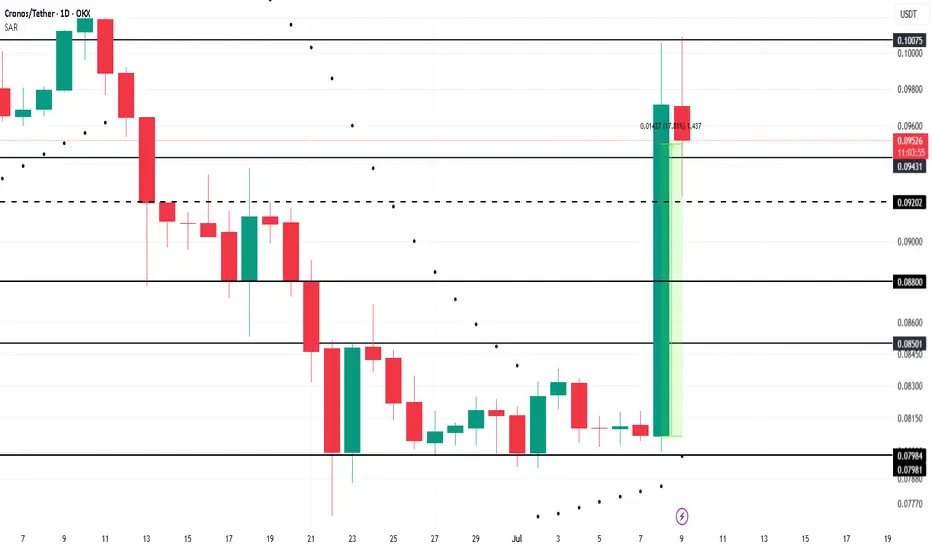
CRO token is currently trying to break the Resistance zone($0.0960-$0.0925) .
Also, in terms of Elliott wave theory , this CRO token price increase with high momentum should be in the form of wave 3 and we can expect a correction to the Potential Reversal Zone(PRZ) for CRO .
I expect CRO to re-attack the Resistance zone($0.0960-$0.0925) after entering the PRZ and rise to at least near $0.1(Round Number) .
Note: Stop Loss (SL) = $0.847= Worst Stop Loss(SL)
Note: If the CRO token breaks the Resistance zone($0.0960-$0.0925) without correction, we can expect a break of the Resistance lines.
Note: It is better to enter a trade if you find the right trigger for a Long position, as a Short position is more risky.
Please respect each other's ideas and express them politely if you agree or disagree.
Cronos Analyze (CROUSD), 4-hour time frame.
Be sure to follow the updated ideas.
Do not forget to put a Stop loss for your positions (For every position you want to open).
Please follow your strategy and updates; this is just my Idea, and I will gladly see your ideas in this post.
Please do not forget the ✅' like '✅ button 🙏😊 & Share it with your friends; thanks, and Trade safe.

Long On CRONOS/CROLong on Cro after a bounce on the 61.8% back to the highs. Also CRO ETF coming with Canary & partnership with President Trump could cause more bullish momentum.

Cronos: Bear Market VibesCronos is resisting the persistent selling pressure after last week's low, but it should soon turn sustainably downward again. We anticipate the imminent bottom of the overarching turquoise corrective wave 2 within the green Target Zone between $0.06 and $0.02. According to our primary scenario, once CRO reaches this new bear market low, it can quickly move upward in the next impulse wave, with the resistances at $0.14 and $0.23 serving at most as temporary pauses.

Cronos is on the move, Could we see it hit $1 soon?The chart is a weekly candlestick chart of CRONOS (CRO) against USD on TradingView, showing price action from late 2023 to a projected point in 2025. Let’s break down the key elements:
Price Movement and Trend:
CRONOS experienced a notable peak around mid-2024, reaching approximately $0.24000, followed by a sharp decline.
After the peak, the price entered a downtrend, forming a descending triangle pattern, which is typically bearish but can lead to a breakout in either direction.
The price has since stabilized in an "Accumulation Zone" between $0.07197 and $0.08925, with the current price at $0.08925 as of April 1, 2025.
Descending Triangle Pattern:
The descending triangle is defined by a downward-sloping resistance line (yellow) and a horizontal support line around $0.08925.
This pattern often signals a potential breakout. A break above the resistance could indicate a bullish reversal, while a break below support might lead to further downside.
The resistance line is currently around $0.13000 to $0.15000, based on the slope.
Accumulation Zone:
The price is in an "Accumulation Zone" between $0.07197 and $0.08925, suggesting that buyers are holding this level and potentially accumulating positions.
Multiple tests of this support level indicate strong buying interest, which could set the stage for a breakout if bullish momentum builds.
Target Projection (TG 1S):
The chart projects a target labeled "TG 1S" at $0.42000, a significant increase from the current price.
This target is likely based on the height of the descending triangle pattern added to the breakout point, a common technical analysis method.
However, reaching $1 (as requested) would require a much larger move, approximately an 11x increase from the current price of $0.08925.
Support and Resistance Levels:
Key support is at $0.07197, with the current price at $0.08925.
Resistance from the descending triangle is around $0.13000 to $0.15000, with a previous high at $0.17018.
A break above $0.17018 could open the door to higher levels, but reaching $1 would require sustained momentum and likely strong fundamental catalysts.
Historical Context and Feasibility of $1:
CRONOS reached an all-time high of around $0.96 in November 2021 during a crypto bull market, so $1 is within historical precedent.
However, the current market environment (as of April 2025) would need to see significant bullish momentum, possibly driven by broader crypto market trends, adoption of the Cronos ecosystem, or major developments in the Crypto.com platform (which CRONOS is tied to).
The $0.42000 target is a more immediate goal, but $1 would require an extraordinary rally, likely over a longer timeframe.
Timeframe:
The chart extends into mid-2025, and the $0.42000 target appears to be a medium-term projection.
Reaching $1 might take longer, potentially into late 2025 or beyond, depending on market conditions.

Breaking: Cronos ($CROW) Surged 26%, Gearing For 300% SpikeThe Price of Cronos ($CROW) spiked 26% today amidst breaking out of a falling wedge pattern- The asset is setting coast for 300% surge to recent ATH recorded in the month of December, 2024 last year.
With build-up momentum and RSI at 68 further hinting at a bullish breakout. The falling wedge pattern depicted on the chart started late December, 2024 last- a move that saw Cronos ($CROW) loosed about 76% of market value, tanking hard albeit the rest of the assets were performing exceptionally well.
What Is Cronos ?
Cronos (CRO) is the native cryptocurrency token of Cronos Chain — a decentralized, open-source blockchain developed by the Crypto.com payment, trading and financial services company.
Cronos Chain is one of the products in Crypto.com’s lineup of solutions designed to accelerate the global adoption of cryptocurrencies as a means of increasing personal control over money, safeguarding user data and protecting users’ identities. The CRO blockchain serves primarily as a vehicle that powers the Crypto.com Pay mobile payments app.
Cronos Price Live Data
The live Cronos price today is $0.105093 USD with a 24-hour trading volume of $407,141,786 USD. Cronos is up 27.11% in the last 24 hours, with a live market cap of $2,792,493,512 USD. It has a circulating supply of 26,571,560,696 CRO coins and the max. supply is not available.

Cronos will reach 0.50$1. Price Action and Trend Analysis
Historical Movement (Late 2023 to Early 2025):
The chart shows a significant upward movement starting around late 2023, where the price of CRO/USD spikes sharply from around $0.0600 to a peak near $0.1800 by early 2024. This indicates a strong bullish trend during this period, likely driven by market sentiment, adoption, or other fundamental factors related to Cronos.
After reaching this peak, the price experiences a sharp decline, dropping back to around $0.0728 by mid-2024. This suggests a correction or profit-taking phase following the rally.
From mid-2024 to late 2024, the price consolidates, fluctuating between $0.0600 and $0.0800, indicating a period of indecision or accumulation.
Recent Movement (Late 2024 to March 2025):
Starting around November 2024, the price breaks out again, surging to a new high of approximately $0.1600 by early 2025. This second rally mirrors the earlier one but doesn’t quite reach the previous peak of $0.1800.
Following this peak, the price begins to decline, forming a descending triangle pattern (more on this below). By March 11, 2025, the price is at $0.08138, as indicated on the right side of the chart.
2. Key Technical Patterns and Indicators
Descending Triangle:
The chart highlights a descending triangle pattern, which is typically a bearish continuation pattern. This pattern is characterized by a flat support line (around $0.0728) and a downward-sloping resistance line (the upper trendline of the triangle).
The price has recently broken below the support level of $0.0728, which is a bearish signal. This breakout suggests that sellers have taken control, and the price may continue to decline.
Support and Resistance Levels:
Support: The $0.0728 level acted as strong support during the consolidation phase and the base of the descending triangle. However, the recent break below this level indicates that this support has failed, and the next potential support might be around $0.0600 (a previous low from mid-2024).
Resistance: The upper trendline of the descending triangle (around $0.1000 at the time of the breakout) acted as resistance. Additionally, the $0.1600 level from the recent peak could serve as a future resistance if the price attempts to recover.
Projected Target (Yellow Arrow):
The chart includes a yellow arrow pointing downward, suggesting a projected price target following the breakout from the descending triangle. In technical analysis, the price target for a descending triangle breakout is often calculated by measuring the height of the triangle (from the highest point to the support) and projecting that distance downward from the breakout point.
The height of the triangle is roughly $0.0872 ($0.1600 - $0.0728). Subtracting this from the breakout point ($0.0728) gives a target of approximately $0.0728 - $0.0872 = -$0.0144. Since prices cannot go negative, this suggests the price could approach $0.0000, but in practical terms, it might find support at a previous low like $0.0600 or lower, depending on market conditions.
3. Volume and Momentum
While the chart doesn’t explicitly show volume bars, breakouts from patterns like the descending triangle are typically more reliable when accompanied by high volume. If the breakout below $0.0728 occurred with increased selling volume, it would reinforce the bearish outlook.
The momentum appears to have shifted from bullish (during the rally to $0.1600) to bearish, as evidenced by the descending triangle and the subsequent breakdown.

Cronos To Grow 1,500%, 2,500% Or More In 2025The same August 2024 support that led to a 250% rise is being activated again in February 2025. This will lead to a new and very strong rise. This time the bullish wave will be many times bigger compared to previous ones. Instead of 250% we might end up seeing 1,500%, 2,500% or more.
Good afternoon my fellow Cryptocurrency trader, this is indeed a very wonderful day.
Notice the high volume present on the chart as support is activated with a higher low, technical double-bottom, and notice all the green sessions. Four consecutive 2D sessions closing green. That's big.
The new b-wave is already developing, already in the making. We have higher highs with a flat bottom, a perfect wide, long-term, bullish consolidation signal.
The first resistance is the upper trendline. This will be broken easily but once it is challenged it is sure to produce a retrace, either big or small. After the retrace, we will see additional growth and this growth is the one that is likely to reach 2,000%+ in the coming months, from bottom to top.
Patience is key. Buy and hold.
Thanks a lot for your continued support.
Namaste.

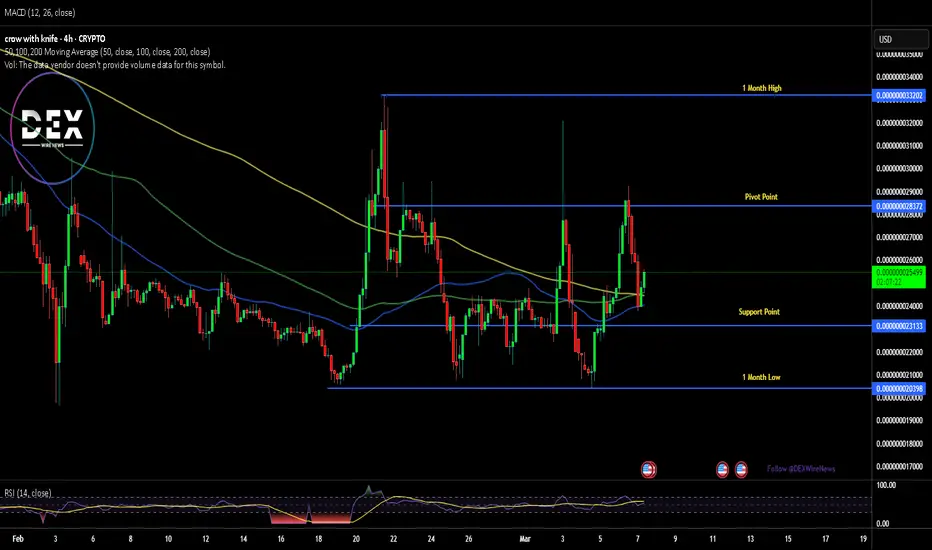
$CAW Gearing Up for a Surge Amidst Bullish Engulfing PatternBuilt on the Cronos ecosystem, Cro Crow coin was the first NFT deployed on the Cronos chain, on block 946. $CROW token has since seen tremendous growth since listing with an all time low of $0.000000009647 SEED_ALEXDRAYM_SHORTINTEREST1:CAW token sky rocket to $0.0000001525 in a span of 20 days.
For that reason, present chart pattern hints at a potential price uptick with massive surge in the horizon amidst a bullish engulfing pattern. And with the Relative Strength Index (RSI) at 53 it gives more credence to the bullish thesis.
However, in the case of a cool-ff, immediate support lies in the 78.6% Fibonacci Retracement level a point that would serve as demand zone should SEED_ALEXDRAYM_SHORTINTEREST1:CAW retrace. Similarly, a breakout above the 38.2% Fibonacci level could pave way for the bullish surge we envisioned.
Asides the Technical aspect, data from DefiLlama shows about $394.74 million accounts for the total TVL locked. This portrays a growing interest in the Cronos ecosystem.
Crow with knife Price Live Data
The live crow with knife price today is $0.0000000251 USD with a 24-hour trading volume of $270,338 USD. We update our CAW to USD price in real-time. crow with knife is down 8.26% in the last 24 hours, with a live market cap of $19,322,981 USD. It has a circulating supply of 769,861,397,731,578 CAW coins and a max. supply of 777,777,777,777,777 CAW coins.
Cronos (CRO) - Bullish Swing - ResurectionCOINBASE:CROUSD been mostly #Bearish, but things are about to change.
Eventually it found its bottoms.
That's when I loaded #Longs around the 6 and 7 Cents Levels.
Eventually I took profit on the #HODL #Trades at 19 Cents a pop.
* all well documented in the related idea.
What's Next for OKX:CROUSDT ?
As the #BreakOut is now confirmed, a #Bullish Swing is about to start.
That would be the #ElliottWave #Impulse (#MotiveWave).
#AltSeason has started, and MARKETSCOM:BITCOIN is adding fuel.
#AltCoins will most likely get pushed by the #BitcoinDominance ( CRYPTOCAP:BTC.D ) #Retracement.
#TotalMarketCap ( CRYPTOCAP:TOTAL3 & CRYPTOCAP:OTHERS ) are also showing signs of new #ATH coming.
COINBASE:CROUSDC #TechnicalAnalysis
- #ElliottWave A-B-C Sequence
- Primary ⓒ (white) #Impulse
- #Fibonacci Time Zones
- #Fibonacci Retracements Confluence
- #Cypher #Harmonic
My #Long Levels On COINBASE:CROUSD
HODL:
- Entry @ 14 Cents
- TP1 @ 40 Cents
- TP2 @ 60 Cents
#Futures ( CRYPTOCOM:CROUSD.P )
- Moderate Entry @ 14 Cents
- Conservative Entry @ 10 Cents
- TP1 @ 40 Cents
- TP2 @ 60 Cents

Cronos: Dive!Cronos has dived into our beige Target Zone between $0.1322 and $0.0884 and should soon reach the projected low of the green wave . In our Zone, the coin should succeed in a bullish reversal, and the following impulsive wave should propel the price significantly above the resistance at $0.23. As CRO has fulfilled the minimum requirements for the wave correction by entering our Zone, it might even head above the $0.23 mark immediately.

CRO - 4h - Accumulation RangeREMEMBER that a lot of investors sell stocks or crypto for fiscal conditions in 2024 to close the year.
For that, we have low buy liquidity , and even with that pressure on the price , CRO is trying to remaning in the same range as 1 week ago, so a breakout can restart a new HH , so patience.
Im bullish on it if the 0,17usd resistance its broken and became a support.

Cronos: Target Zone AheadCronos (CRO) has recently been steering a less volatile sideways course. We have identified a beige Target Zone between $0.13 and $0.08, which should catch the low of the ongoing wave in green, thus presenting an opportunity to open long positions. However, if the price directly breaches the resistance at $0.23, we will have to consider the green wave alt. as complete, and the outlined Target Zone will be missed. We assign a 33% probability to this alternative scenario.

#Cronos $CROUSD PlanCRYPTO:CROUSD Is currently seeking demand. The closest significant demand located around the 0.1200 : 0.1000 zone. Pay attention to this price range as it is anticipated to bounce off.
#CRYPTO #CRO #CRONOS #CROUSD #CRYPTO.COM #CRYPTOCURRENCY #CRYPTOANALYSIS #AHMEDMESBAH

#Cronos $CROUSD Is testing a breakout wedge#Cronos CRYPTOCOM:CROUSD is currently testing a significant breakout wedge where it is anticipated to bounce off it.
In case of a daily close below 0.1300 there could be a free fall back to 0.0800
A daily close above 0.2400 is a breakout and will unlock a new zone up to 0.4500
#Cronos #Cro #Crypto #CryptoCurrency #Crypto.com

Trading opportunity for CROUSDTBased on technical factors there is a Buy position in :
📊 CROUSDT
🔵 Buy Now
🪫Stop loss 0.17200
🔋Target 1 0.22000
🔋Target 2 0.24500
🔋Target 3 0.29900
💸RISK : 1%
We hope it is profitable for you ❤️
Please support our activity with your likes👍 and comments📝

Cryptocom in Bearland- Like most altcoins, CRO remains deep in its bear market.
- Until BTC rallies significantly, altcoins will likely stay overshadowed.
- BTC dominance (BTC.D) is climbing near 60%, putting pressure on altcoins.
- As always, check the bubbles, follow the trends
- Everything you need is in the chart.
- What’s the best approach?
- Be patient and continue DCA.
- Buy at the good time.
Buying CRO in this market:
Option 1: Wait for a return to the bottom around $0.05—(ideally a full-buy range).
Option 2: Wait for a breakout and weekly close above $0.10 for confirmation.
- Whether trading or holding, consider taking partial profits on the way up.
- For the short term, consider taking profit around $0.50, as there’s resistance in this area.
- For those waiting on the altcoin bull run, a max target of $1.5 to $2.5 is reasonable.
Happy Tr4Ding !

Cronos (CRO)📊 Overview of Analysis
The cryptocurrency CRO, recognized as one of the high-potential assets in the crypto market, entered a downward trend and moved into a descending channel following a significant drop. After testing the weekly support level, the price shifted into a new descending channel with a gentler slope.
🕰 Daily Timeframe Analysis
🔸 Current Status:
After breaking through the descending channel's resistance and the weekly resistance, the price is undergoing a pullback toward the broken channel.
🔸 Price Targets (Fibonacci Levels):
First Target: Level 1.618, already achieved.
Next Target: Level 2.618, if the price consolidates above the green zone.
Long-Term Target: Potential movement to the Over-Extended level if the RSI's orange zone resistance is broken.
📈 RSI Indicator Analysis
🔹 The RSI suggests that a breakout above the orange level could act as a trigger for further upward momentum, pushing the price toward higher targets.
💡 Conclusion
The upward trend remains strong, contingent upon stabilization above key levels.
Risk management is crucial, especially with possible pullbacks toward lower levels.
💬 Note: Always combine technical analysis with thorough research before making investment decisions.

Cronos CRO In Trouble - BUY & HODLCronos can go bust, but even so, it's on Sale.
CROUSD / CROUSDT will go straight bull at one point.
So, I am still buying these poopy coins on each major fall they have.
Yeah, that's what I do.. putting my money into a black hole.
My next good BUY LEVEL: $0.03 .
Who knows, maybe I'll actually get rich.
My Technicals on CRO:
* Elliott Wave A-B-C Pattern
* Fibonacci Retracements
* Fibonacci Time Zones
* Double Bottom
* Cycle Analysis
* Bullish Divergence
Fibonacci Time Zones tell me that the beginning of '23 will be amazing!

Is CRO Facing a Make-or-Break Moment? Key Levels to WatchYello, Paradisers! Is #CROUSDT on the edge of a major move or not? Let's discuss the latest analysis of #Cronos to see what's happening:
💎After 5-6 months of a slow and steady downtrend, #CRO is now approaching a critical juncture. The price is nearing the major demand zone at $0.0733, setting up for a retest that could spark a bounce—just as it has done multiple times in the past. But the question is, can the bulls seize this opportunity to reignite bullish momentum and break out of the descending channel?
💎For #Cronos to fuel a breakout, it needs to overcome the internal resistance at $0.092, a level that previously acted as strong support but has now turned into a significant barrier. Breaking above this level, especially if supported by increasing trading volume and the 20 EMA, could indicate that the bulls are ready to take control and push prices higher. If this happens, a rally toward the next major resistance could be on the cards.
💎However, if the bulls fail to maintain their push, there is a risk of a pullback toward the crucial demand zone at $0.0730, potentially retesting the breakout point. Failure to hold this level may trigger a slide toward $0.0673.
💎The real risk emerges if $0.0673 does not hold. A breakdown at this support would likely shift control back to the bears, leading to a deeper correction and squashing hopes of a short-term bullish recovery.
Stay focused, patient, and disciplined, Paradisers🥂
MyCryptoParadise
iFeel the success🌴

Cronos (CRO) - Bullish divergenceOn the above 6-day chart price action has corrected 92% since November 2021 @ 70 cents. A number of reasons now exist to be long, including:
1) Price action and RSI resistance breakouts.
2) Strong bullish divergence as measured over 60 days. 8 oscillators print positive divergence with price action.
3) Look left (orange line, best seen on 2-day chart) price action prints on historical support.
4) The macro bull flag forecasts a first wave target of 30 cents.
Is it possible price action could fall further? Sure.
Is it probable? No.
Ww
Type: trade
Risk: <=6% of portfolio
Timeframe: act now
Return: 400%
