This time its different.....What amazes me about the whole cycle is how close both topping patterns played out.
1. The double top pattern with a lower higher on the daily market the top and a massive drop.
2. This phase of the pattern was not exactly the same. 2017 we had a 98% bounce and in 2022 we had a 41% bounce but it did take around the same time before starting the next leg with 2017 taking 52 days and 2022 taking 62 days.
3. Now this is where things start lining up pretty damn well , same impulse move up and a double top but with a higher high trapping in everyone thinking we were going higher.
Now this entire move was all orchestrated. I explain why in detail below in a different TA .
4. This phase was nearly a perfect mirror from 2017 and it was obvious at this point at least to me that bitcoin was in full distribution , which tends to happen in bear markets.
5. After phase 4 is over then proceed to pump 41% in 2017 and 45% in 2022 , only to return back to marker 2.
The bull market blueprint of 2021 was in 2017 , the same players using the same tactics to leave most of retail high and dry. They don't even bother to change the way they do it, rinse and repeat .
I always thought Bitcoin was the people's money but now after this bullrun and understanding the way they move the market I really don't think so anymore, the same 7-10 year old wallets shift the market right in plain sight , everyone has access to glassnode just go there set 7-10 year old wallets and see for yourself , market is rigged.
Check out the comments I posted on this TA published nearly 2 months before this crash. That weekend I was getting massive alarms for the 7-10 year old wallets, same story different cycle…..
There is still hope for decentralisation and to bring power back to the people but it's not through Bitcoin , it's through cult dao .
A project that is bringing back true decentralisation.
The Website -https://cultdao.io
The Whitepaper/manifesto -https://cultdao.io/wp-content/uploads/2022/01/CULT-DAO-Manifesto-1.pdf
CRPTOCURRENCY

BTC! Analysis Double BOTTOM!!Hey Everyone BTC have finally made its double bottom On the RSI higher high RSI Reversal. We are seeing a bullish market on Btc after breaking below 30k. Few days later BTC is bought back now above 30k. Is this what the bear been waiting for? We can see big buy under the 30k. We may see BTC running back to the 40k in a few weeks. Follow for more free analysis.

FTT/CRO FUTURESThink of FTX token as Apple & Crypto.Com as Gamrstop... Now you know where retail will pile into and where the deep liquidity is.
FTT = stability
CRO = affordablity

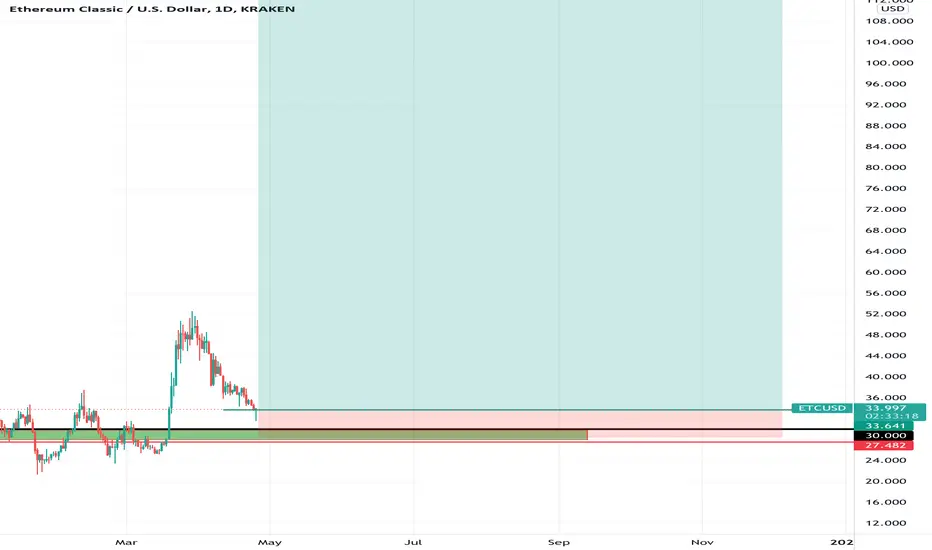
Algo Bull incomingAlgo just increase its stake reward on coinbase the highest earner rewards. Massive buying volume have already started Algo stake reward payout daily and higher then most other coins atm. Coin have potential moving up in the next few days. Algo reach its low at .35cent and pulled back .10 which is very low. The RSI have shown double bottom inverse.

ATOM Recovery Atom look like it pulled back from low of $8 we and up already we may see bullish in a few weeks. This coin will let you get a 5%+ APY on some of the exchanges. This one have not change since. This coin have High potential for it to recover back to $40. RSI way over sold in the 3 day time frame. Resistant in at the $10. The market is making a recover after fear.

Luna Way over sold possible millionare?Wow Luna drop all the way to 1 cent. from 100 dollars. Look like i have to get in this just because the fud is around im have to put a little investment here. Prob shock the world later on who knows. This is very interesting for luna. This is not financial advice but Luna looks awfully cheap. Who knows it might do a $50 buck run.

LUNAUSDT MELTING!!Remember to take your dam profits - BUY LOW SELL high dont follow the retail herd and fomo into bad positions at all time high prices.

$LUNA - The Way ForwardHEAD AND SHOULDER BEARISH PATTERN SPOTTED.
What does that mean? Bearish Bearish Bearish! We may get to $50 and even lower soon to complete the setup.
But before that, we should expect and plan to catch the next short term rally to $70 possibly.
Entry would be lower time frame after confirming exhaustion.
Don't forget to like and follow for more trading updates and free signals.
#$KC #Meekhill #Meekhillacademy #RICHMMDT

Axie Infinity (AXS) Buy ZoneAxie Infinity (AXS) Buy Zone
--------------------
BIAS
Mid-Term : Bullish
Risk : High
On 4 hours timeframe Axie Infinity formed bullish pattern which shows the possible reversal at $29 zone.
--------------------
$AXS/USDT LONG SETUP
Leverage : x3 - x5
Entry Price : 28.8 - 27.9
TP 1 : 31
TP 2 : 32.5
TP 3 : 33.9
TP 4 : 35.25
TP 5 : 37.8
TP 6 : 39.75
TP 7 : 42.4
TP 8 : 46
Stop Loss : 26.5
*Maximum 3% of Portfolio.
*Unload 12.5% at each TP. Whenever TP 2 hits, Move stop loss to entry.
--------------------

SANDUSDT SETUPSANDUSDT price has reached a confluence zone of Fib level and EMA 400. This area is critical for bulls to retain as on breaking there is no major support available. So, we are expecting the triangle squeezing and support may attain some accumulation and an upward surge will start soon.

Rune 4h TradeSetup: Rune has been up on an uptrend recently and has bounced off its 200D EMA, meaning the uptrend is still intact. Furthermore, Rune has good fundamentals in its ThorSwap, increasing demand for Rune
Entry: 9.6445
TP: 11.816( trail using SAR)
SL: Trailing SL using SAR

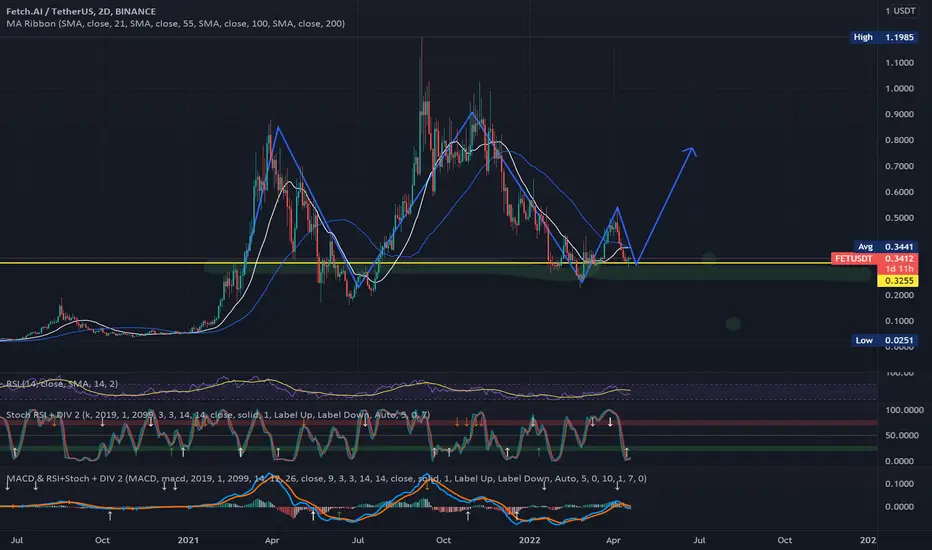
FET/USDT#FET/USDT ANALYSIS
###################################################################################################################################################+
It is holding above horizontal and trendline support. MACD crossover is loosing bearish momentum. As it is currently creating a higher low, so a good volume will confirm a bullish move from here and a sustain breakdown of the support would confirm bearish move. FET has real great project. you can buy it under 0.35
BUY ORDER < 0.344
SELL ORDER >= 0.37-0.70
Targets:
T1: 0.37
T2: 0.42
T3:0.47
T4: the moon
If u agree & like my trading still give me some like and follow me boss! love all of u !!!
HAPPPY TRADING!!!
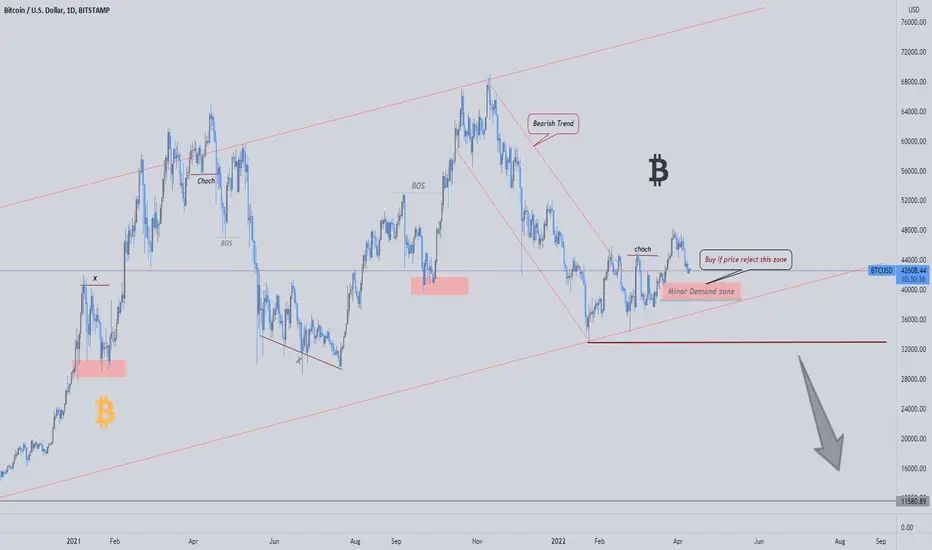
BTCUSDT This should do unless there is a break of structure (BOS) that would appeared to spoil the setup
Stoping and reversing at 37,500 is enough I guess
Now let’s watch for e next BIG move
Success traders

OMG predictionOMG prob go down one more time and then run for its next move. We will she this in a few months. A little more short then it will move to the up side.
Follow for more free analysis daily. Watch my previous prediction dm me if you have question or want to talk more about crpto

RGT Potential BullForming a W pattern. Possible run back to resistant line if it breaks above that line we will see a runner. If this coin breaks below The resistant line we will see this one continue to Go down till 10-30 rsi. Most indicator shows more bullish then bear.
Follow me for more Free analysis.

Shiba drop on Robinhood!Shiba finally trading on Robinhood we saw a big spike on the first day this landed on robin hood which hit .00003. Alot of buyers got their hands on this coin. The Shiba metaverse have not even been drop yet. Get ready for this coin to have continue growth for the next few months. Analysis shows a bull coming.
Follow for more Free analysis this is not financial advice I am also not a license advisor do your research.

COMP Bullish On RobinhoodFew days ago four coins was drop on Robinhood. World is continuing to accept cryptocurrency. Possible long turn hold heading back to ATH. We may see resistants in the middle of this up trend would say about 2023 we may see ATH.
Follow me for free analysis.

LONG POSITIONAre You ready to this Big Bull Move in Expected 2022 as per Technical Analysis .
Let see what Will be Next Move.
Keep and eye on BTC for the next move 38k & 40k zones are very sensitive for Buyers.
Solana - Crypto Chart - Trend AnalysisThe point today I am focusing is that on 1 day chart it seems that SOL has taken a great support.
The Sol is going to trade few more days below 120usd. And let is consolidate.
Wait till it gives closing above the blue line (200 Weighted MA)
Hold till 1st target of 155-160 USD.
And, second target in upcoming months is 200 USD.

MCB 1h shortSetup: MCB is on a downtrend. Furthermore, the big red candle rejection off the 20 EMA confirm this.
Entry: 4.88
SL: Trail using ATR trailing stop loss value of 3.1. Current value is at 5.07
TP: 4.36

The Triangle Of Death (Bitcoin Event May 2022)We have been here before , August 2019 to be exact. Traded the same type of triangle down to a 7k Bitcoin at the time. Take a look below (First TA so rough around the edges ,also ignore the x50 it was a different time lol)
Just like 2019 I think there is more a chance that we come down than up.
Fib Circle 2.36
Fib Time Zone 2.618
Last week of may 2022 we will most likely break this triangle down to the 200 weekly.
200 Weekly Prices
Today - 21000
May 25th -22400
July 23rd -24100
Price can of course wick down lower than the 200 weekly it has historically but we have never closed a weekly under it , take a look below .
The last Chainlink fib sequence will come into play , May 23rd 2022 , using LINK/BTC dominance chart I discovered this Fib time sequence that has caused massive moves in LINK and BTC so next and last date May 23rd 2022.
So last two death cross on the 3D chart has resulted in Bitcoin moving down to the 200 weekly
Predicted cross 19th of May .
And finally on average it takes Bitcoin 400 days to go from cycle peak to 200 weekly, which end of may would be 400days.
(segment taken from previous TA ,)
The top in April 2022 was the true cycle top the one that followed after was just pure manipulation , that run to 70k was just a trap , with only half of the Bitcoin address active for that run , price still managed to get to all time high and like clockwork the 7-10 year old wallets come in again and sell a massive amount of Bitcoin creating yet another Bitcoin top. So yeah that run was created by the few ,there was no hype , no retail just whales. Take a look at the link below of on-chain data.
ibb.co
So everything all of sudden is coming together for end of may 2022.
1. End of the Fib circle 2.36
2.End of Chainlink sequence May 23rd 2022
3.200/50 Death Cross 3D predicted cross
4.Average of 400 days from Cycle Peak to 200 weekly
Its so crazy seeing everything lining up , Buckle up!

LTC until mid-June I express an opinion based on my skills. The levels in red can make a profit. These are pretty strong levels there will be a return from there. This is not financial advice.
