USOIL GROWTH AHEAD|
✅CRUDE OIL broke the key
Structure level of 69.50$
While trading in an local uptrend
Which makes me bullish biased
And I think that after the retest of the broken level is complete
A rebound and bullish continuation will follow
LONG🚀
✅Like and subscribe to never miss a new idea!✅
Disclosure: I am part of Trade Nation's Influencer program and receive a monthly fee for using their TradingView charts in my analysis.
Crude-oil

CRUDE OIL REBOUND AHEAD|LONG|
✅CRUDE OIL is going down now
But a strong support level is ahead at 64.69$
Thus I am expecting a rebound
And a move up towards the target of 65.50$
LONG🚀
✅Like and subscribe to never miss a new idea!✅
Disclosure: I am part of Trade Nation's Influencer program and receive a monthly fee for using their TradingView charts in my analysis.

CRUDE OIL Risky Long! Buy!
Hello,Traders!
CRUDE OIL will soon hit
A horizontal support
Of 64.50$ and as it is
A strong level we will be
Expecting a local bullish
Rebound on Monday
Buy!
Comment and subscribe to help us grow!
Check out other forecasts below too!
Disclosure: I am part of Trade Nation's Influencer program and receive a monthly fee for using their TradingView charts in my analysis.

USOIL POTENTIAL LONG|
✅CRUDE OIL has retested a key support level of 65.00$
And as the pair is already making a bullish rebound
A move up to retest the supply level above at 66.27$ is likely
LONG🚀
✅Like and subscribe to never miss a new idea!✅
Disclosure: I am part of Trade Nation's Influencer program and receive a monthly fee for using their TradingView charts in my analysis.

WILL CRUDE HOLD BEARISH TREND DURING FED CHAIR POWELL SPEECH?!!?CRUDE OIL
Looking for a BEARISH continuation, of last week's Friday Fall.
Take Profit near 2.00 Extension level (64.715)
Stop Loss above the previous Hourly high candlestick (66.103)

CRUDE OIL Bearish Flag Breakout! Sell!
Hello,Traders!
CRUDE OIL is trading in a local
Downtrend and formed a bearish
Flag pattern and now we are
Seeing a bearish breakout
So we are bearish biased
And we will be expecting
A further bearish move down
Sell!
Comment and subscribe to help us grow!
Check out other forecasts below too!
Disclosure: I am part of Trade Nation's Influencer program and receive a monthly fee for using their TradingView charts in my analysis.

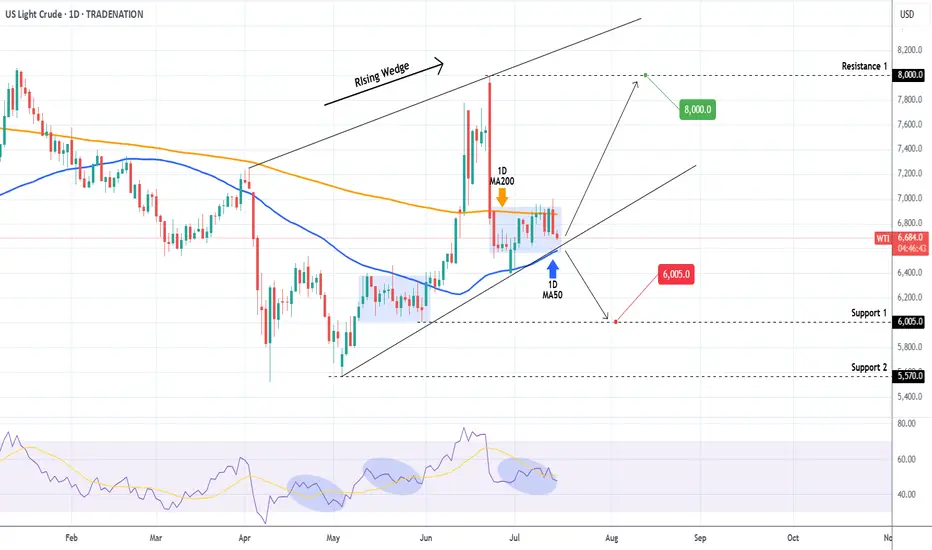
WTI OIL Is it forming a bottom?WTI Oil (USOIL) Has been trading within a Rising Wedge pattern and since June 02, it has turned its 1D MA50 as a Support. Technically the recent 2-week consolidation within the 1D MA50 (blue trend-line) and 1D MA200 (orange trend-line) is a bottom formation on the Higher Lows trend-line of the Rising Wedge.
As long as the 1D MA50 holds, we remain bullish, targeting $80.00 (Resistance 1). If the 1D MA50 breaks (closes a 1D candle below it), we will take the loss, and turn bearish instead, targeting $60.05 (Support 1).
-------------------------------------------------------------------------------
** Please LIKE 👍, FOLLOW ✅, SHARE 🙌 and COMMENT ✍ if you enjoy this idea! Also share your ideas and charts in the comments section below! This is best way to keep it relevant, support us, keep the content here free and allow the idea to reach as many people as possible. **
-------------------------------------------------------------------------------
Disclosure: I am part of Trade Nation's Influencer program and receive a monthly fee for using their TradingView charts in my analysis.
💸💸💸💸💸💸
👇 👇 👇 👇 👇 👇
WTI OIL Best scalping opportunity at the moment!WTI Oil (USOIL) has been consolidating inside a ranged trading set-up, with the 4H MA100 (green trend-line) as its Resistance and the 4H MA200 (orange trend-line) as its Support.
We saw this previously from May 13 to June 01 and it presents the best scaling opportunity in the market at the moment. That previous Ranged Trading pattern eventually broke upwards as the Higher Lows trend-line held.
As a result, after you get your scalping profits within this range, look for a clear break-out above the 4H MA100 (candle closing) in order to go long (Resistance 1) or a break-out below the Higher Lows (candle closing) in order to go short (Support 1).
-------------------------------------------------------------------------------
** Please LIKE 👍, FOLLOW ✅, SHARE 🙌 and COMMENT ✍ if you enjoy this idea! Also share your ideas and charts in the comments section below! This is best way to keep it relevant, support us, keep the content here free and allow the idea to reach as many people as possible. **
-------------------------------------------------------------------------------
Disclosure: I am part of Trade Nation's Influencer program and receive a monthly fee for using their TradingView charts in my analysis.
💸💸💸💸💸💸
👇 👇 👇 👇 👇 👇

Crude oil $ukoil - Final falling oil has been a barometer of the financial market for the last decades.
I look at the formations and I see that we will see a renewal of the bottom in the coming months, I will not say the reasons, you just need to wait a little.
I've been talking about the fall for a long time, but it's not over yet.
After the final fall, I expect a renewal of the highs, due to the worsening situation in the Middle East, this will be after September
Best Regards EXCAVO

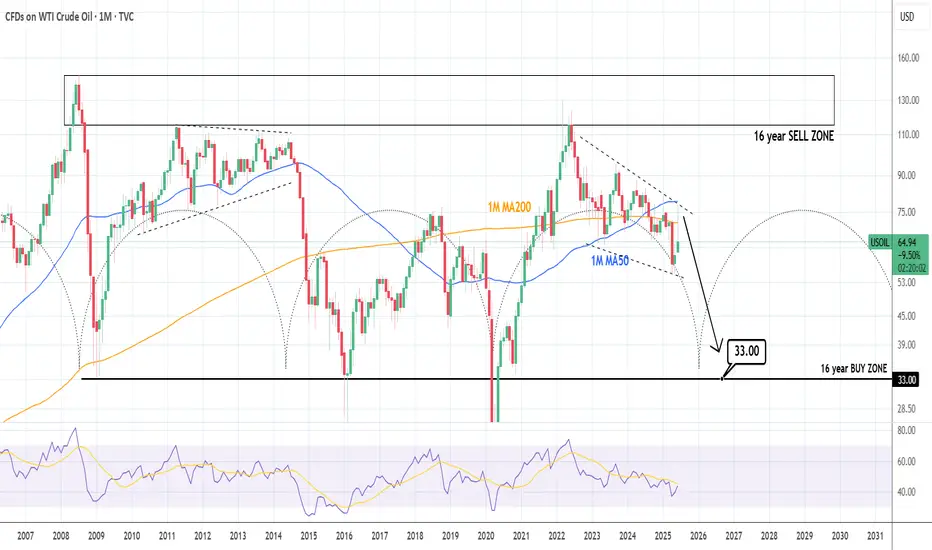
WTI CRUDE OIL: Brutal collapse expectedWTI Crude Oil has turned bearish again on its 1D technical outlook (RSI = 44.990, MACD = 0.310, ADX = 38.289) and is expected to accelerate the effect as based on the 16 year Cycles, late 2025 and most of 2026 should experience a price collapse. The most optimal Buy Zone starts at $33.00, it could go lower but that's a solid base from which to expect a bounce back above $110.00 by 2028.
## If you like our free content follow our profile to get more daily ideas. ##
## Comments and likes are greatly appreciated. ##
Crude oil is displaying serious weaknessCrude oil is trapped in a descending triangle after a blow off top. might take some time to play out but target for crude oil based on the triangle is 42-40 crude oil.

WTI OIL Massive rejection on the 1D MA200.WTI Oil (USOIL) has been trading within a Channel Down for over a year now and today its latest Bullish Leg hit the 1D MA200 (orange trend-line) for the first time since February 03 2025.
Unless we see a sustainable structured rise that turns it into a Support, the long-term bearish trend should prevail, and the market has already reacted to this with a strong rejection.
With the 1D RSI almost overbought (>70.00), being consistent with the last 3 major tops, we expect a gradual decline towards Support 1, as it happened on the January - February 2025 Bearish Leg.
Our Target is just above it at $55.50.
-------------------------------------------------------------------------------
** Please LIKE 👍, FOLLOW ✅, SHARE 🙌 and COMMENT ✍ if you enjoy this idea! Also share your ideas and charts in the comments section below! This is best way to keep it relevant, support us, keep the content here free and allow the idea to reach as many people as possible. **
-------------------------------------------------------------------------------
💸💸💸💸💸💸
👇 👇 👇 👇 👇 👇

WTI Crude Oil Stalls At Technical JunctureCrude oil has enjoyed a decent rally in recent weeks thanks to improved sentiment and OPEC+ scaling back production. Yet momentum turned against bulls on Tuesday, despite positive trade talks between the US and China. Today I discuss whether this could be a turning point for oil, or simply a bump in the road.
Matt Simpson, Market Analyst at City Index and Forex.com

WTI Crude Oil Testing Make-or-Break Support ZoneWTI crude is grinding into a pivotal horizontal support near 6,020 after another sharp rejection near the 50-day SMA:
Support at Risk: Price is pressing into the horizontal support zone formed by May’s lows (~6,020). A clean break below would shift momentum back decisively to the downside.
Bearish Structure: Price remains well below both the 50- and 200-day SMAs, which are angled downward—consistent with a medium-term downtrend.
Momentum Fading: MACD is negative and turning lower again, while RSI is stuck near 45 and showing no bullish divergence.
Next Support: If support fails, next downside level is likely around the YTD low near 5,400.
As it stands, bears remain in control unless bulls can defend this floor and drive a breakout back above the 50-day SMA.
-MW

CRUDE OIL Local Long! Buy!
Hello,Traders!
USOIL has retested a
Nice round horizontal
Support level of 60$
And we are predictably
Seeing a bullish reaction
From the level which we
Believe will take the price
A bit higher still
Buy!
Comment and subscribe to help us grow!
Check out other forecasts below too!
Disclosure: I am part of Trade Nation's Influencer program and receive a monthly fee for using their TradingView charts in my analysis.

Crude oil gains could be limited. Here's whyAlong with other risk assets, crude oil has had a positive day, albeit a much quieter one compared to the major indices. It has been held back in part by the dollar also finding good support. So, I think a large part of the rally today in WTI is just a function of the market pricing in higher demand because of lower tariffs. Thus, it is the removal of a bearish factor driving prices higher, which could be factor for a while yet as market finds a new equilibrium. The underlying issue of an oversupplied market is what will ultimately determine oil prices. On that front, you have the OPEC ready to release more withheld supplies as it doesn’t want to lose more market share to non-OPEC producers. Thus, the upside linked to a brighter demand outlook should be capped. So, while I do think prices may rise a little further, I don’t think that we will see significantly higher prices with the current state of supply picture. I wouldn’t be surprised if $70 turns into resistance now on Brent, or if WTI holds this shaded yellow resistance range you can see on this chart around $65 area.
By Fawad Razaqzada, market analyst with FOREX.com

CRUDE OIL Bullish Breakout! Buy!
Hello,Traders!
CRUDE OIL is making a bullish
Correction from the lows and
The price made a bullish
Breakout of the key horizontal
Level of 60.10$ then made a
Retest and a rebound so we
Are bullish biased and we will
Be expecting a further bullish
Continuation on Monday
Buy!
Comment and subscribe to help us grow!
Check out other forecasts below too!
Disclosure: I am part of Trade Nation's Influencer program and receive a monthly fee for using their TradingView charts in my analysis.

WTI CRUDE OIL: Short term rebound on RSI Bullish DivergenceWTI Crude Oil is bearish on its 1D technical outlook (RSI = 38.958, MACD = -2.110, ADX = 28.985) as it remains on a multi-month Low. The 1D RSI however displays a HL Bullish Divergence and this can cause a short term price rebound. The Resistance is the Pivot Zone and short term the LH trendline is what maintains the downtrend. Consequently, we are now bullish, TP = 64.90.
## If you like our free content follow our profile to get more daily ideas. ##
## Comments and likes are greatly appreciated. ##

USOIL SHORT SIGNAL|
✅CRUDE OIL made a retest
Of the horizontal resistance level
Of 59.80$ and we are already seeing
A bearish reaction so we are bearish
Biased and we can enter a short trade
With the TP of 58.10$ and the
SL of 59.93$
SHORT🔥
✅Like and subscribe to never miss a new idea!✅
Disclosure: I am part of Trade Nation's Influencer program and receive a monthly fee for using their TradingView charts in my analysis.

WTI OIL Oversold rebound at the bottom of 7-month Channel Down.WTI Oil (USOIL) hit last week the bottom (Lower Lows trend-line) of the 7-month Channel Down while its 1D RSI turned oversold (<30.00), the lowest it's been since March 2020 and the COVID crash.
Naturally, the price rebounded but still hasn't even tested the 1D MA50 (blue trend-line), which indicates that it remains a strong medium-term buy opportunity. With the previous Lower Low almost reaching the 0.786 Fibonacci retracement level, we expect to see at least $72.50 in the medium-term.
-------------------------------------------------------------------------------
** Please LIKE 👍, FOLLOW ✅, SHARE 🙌 and COMMENT ✍ if you enjoy this idea! Also share your ideas and charts in the comments section below! This is best way to keep it relevant, support us, keep the content here free and allow the idea to reach as many people as possible. **
-------------------------------------------------------------------------------
Disclosure: I am part of Trade Nation's Influencer program and receive a monthly fee for using their TradingView charts in my analysis.
💸💸💸💸💸💸
👇 👇 👇 👇 👇 👇

CRUDE OIL... Time to BUYPreviously posted and heads up...
Did not quite work immediately because of POTUS and the Trade War II/
Did a cliff dropper and now it looks about ripe for the rally, confirmation when it is above the resistances shown.
Heads up!

WTI CRUDE OIL: Channel Down bottomed. Buy opportunity.WTI Crude Oil is heavily bearish on its 1D technical outlook (RSI = 38.039, MACD = -2.310, ADX = 38.046) as it is trading inside a Channel Down for more than 1 year. Last week's low has made a technical LL at the bottom of the pattern and the current consolidation indicates that this may be an attempt to initiate the new bullish wave. The 1D RSI recovered from being oversold previously and this potentially hints to a rebound over the 1D MA200. The last bullish wave crossed above the 0.618 Fibonacci marginally. Trade: long, TP = 71.00.
## If you like our free content follow our profile to get more daily ideas. ##
## Comments and likes are greatly appreciated. ##

WTI CRUDE OIL: Potential bottom and massive rebound to 71.00.WTI Crude Oil got oversold on its 1D technical outlook (RSI = 31.096, MACD = -1.620, ADX = 38.232) but is recovering its 1W candle now as it hit the bottom (LL) of the 1 year Channel Down. If the 1W candle makes a green closing, we will consider this a bottom, as the 1W RSI is also on its LL trendline) and go for a long aimed as the previous one at the 0.618 Fibonacci (TP = 71.00).
## If you like our free content follow our profile to get more daily ideas. ##
## Comments and likes are greatly appreciated. ##
