WTI CRUDE . Long term Target HiTI posted a chart on 10th MAY, WTI can potentially reach 76/78$ before it drops .. The long term target has been hit, More downside is really temporary for me right now. Worst case scenario is $48 but 51.5/52$ should hold strongly. I expect a massive upside upto $100/104 from here. Not maybe would agree to that but I would be loading up from 53/51/48. everytime it touches these levels. As the downside Risk looks far less than upside.
I have attached my MAY 10th Call for Short.
Crude-oil

You need water to survive in the desert. An Oil bull is around )Got the title? :D
This is what Oil bull saw:
This is what they should have seen:
By the way, the dow is in a similar situation to Oil a few months ago, it MIGHT reverse (with these 650 billion borrowed $), not shorting it yet, but I sure am not going long I am telling you this.
It's all just a war between bulls & bears.
In my opinion, a good countertrend/reversal trader will now wait for bulls to show up, and start winning some battles.
Yes a v shape is possible (is it actually?) but I think it is very unlikely, I'd rather miss out something that happens once every 15 times.
The bulls got rekt so hard smh.
Whether you are trend following or counter trend, you got to know when the war is starting to look bad and run away like the dirty coward you are.
This is a war where scheming deceitful cowards win, not "never give up never surrender" heroes.
If you want to be a warrior, join the counter trend traders but wait for others to fight for you first, then charge and help the losing side turn the tide.
There is no way (that I know of) to do this mecanically or write it down, it's all an art, a discretionary art.
I strongly believe doing things this way is far more dangerous than simply following the trend. The thrill of the hunt <3
I will look for the bulls to show the tip of their noses before the box to consider joining them in the box.
Will update this. For now I am just pointing and laughing @ reKt bulls.


12 NOV WTI / Crude oil Wyckoff + EW 15 M Short + Long scalpsHowdy folks! I have erroneously assumed the WTI is doing an accumulation - whilst it has one on M15, it has failed the BU/LPS stage and the rejection at the trendline enforces the belief that we are actually witnessing a re-distribution, currently making its way to SOW stage. Whilst bias is bearish (with sights set on 58,8 - 58,6) there will be a handful of long scalping opportunities. I contemplate entering on the short side upon open of the market on Sunday, bailing out @ previous LOD, loading long scalps there for 59,7 -,9 again and then shorting from there to $58.
I will try to update the chart based on PA. GL!

Long the bounce off 1.414Oil hit the 1.414 fib on the chart which is 59.30.
It made a low of 59.29 - talk about accuracy.
I'd observe the price action carefully before entering a long position in the coming week but there is a high chance it'll retrace back to the 64.5 mark.

Short / Long scalp M15 WTI / Wyckoff / EW Hi Folks,
We have attained our low 59 tgt. It appears (although its very early to say) that an accumulation has begun - I believe we've just witnessed AR. Sorry for the simple chart but in the interest of time I am publishing it now. Will properly elaborate it and publish a.s.a.p. I will position shorts 59,9 for low 59 - 58,9 (as spring) and then will load on buys. GL!

Bullish Trade of the Week Selling a put in RIGTaking a play on the drop in Crude Oil prices and potential geopolitical uncertainties with a put sale in RIG which appears to be in a long term consolidation pattern Looking to sell a 52d 10 put for .64 to .68 this week

CRUDE OIL 4H SWING SHORT CL1!If price breaks the ascending trendline we have a good chance to test 67 and probably 65.

RSI 100 downtrend 50 EMA crossed over 600 EMA and is in very fine falling position. Price pulled back to Tenkan line and will keep dropping.
Trade trends after 50 EMA (it has to be in declining or rising position). Enter trades upon pullbacks to Ichimoku´s Tenkan line. Trend ends when you will observe divergence in long term RSI (70-100) - when RSI unlike price will fail to make new high.

WTI Oil Long, watch inventories at 4pm GMTOil continues to push up further
bounce from the 0.618 level on the fib looking for more gains towards $78
crude oil inventories news at 4pm GMT, will be some fireworks there
good trades

Brent Crude Oil. $100 is not a miracleTabloids and analysts call for $100 amid Iran fallout of supply chain.
This simple chart confirms this fear as the contact area within a possible large triangle
sits right between 95 and 98 levels.

USOIL short oportunityStrong sells still on chart USOIL
Back test of 68,30, from this point we will see strong sell again
Entry 68,33
SL 69,33
TP 66,14

USOIL Looking goodUSOIL showing Gartley pattern is completed and this is maybe the last chance to rebound before breaking the trend line support..


Once Crude Breaks $65 - watch out below.Once crude oil breaks $65 ppb, watch out below. A very quick move to near of below $58 could happen pushing longs to cover.
Be prepared for this move and watch for a breakdown in price as a key trigger. My assumption is this will happen before the end of August.

USOIL Still inside up channel..USOIL Currently on a good support area the up trend line & 78.6 Fibo. also we are waiting for AB=CD pattern which is can lead crude oil to the new high.

Crude Oil. Possible wave count. Target $71.00Oil broke up the triangle in wave X.
The target for wave Y = wave W = $71.00

Crude Oil May Falls As The Trade War Sentiment DominatesCrude oil is holding in an oversold region. The series of doji and spinning top candlestick patterns are suggesting a potential of bullish retracement. But it will depend upon $66.50. Above this, the market can go after 38.2% retracement level of $67.45. The bearish breakout of $66.50 can extend sell-off until $65.75. All the best and trade with care...

USOIL-WTII will look for a possible move up to break that high and finish a correction, then the sell.


Crude looks bearishClues
(1) ascending wedge in downtrend is bearish (but agreeably the next major trend is bullish)
(2) price where a large resistance line exists and a former support line is now acting as resistance
I think it would be wiser to wait and buy when price goes back down to the stronger trend support line (in black).
That said, any short position here should have a tight stop.
Bear
Here is how I envision the short trade to go if you were to take it right now.
Bull
Here is the bullish case - buying the breakout retest.

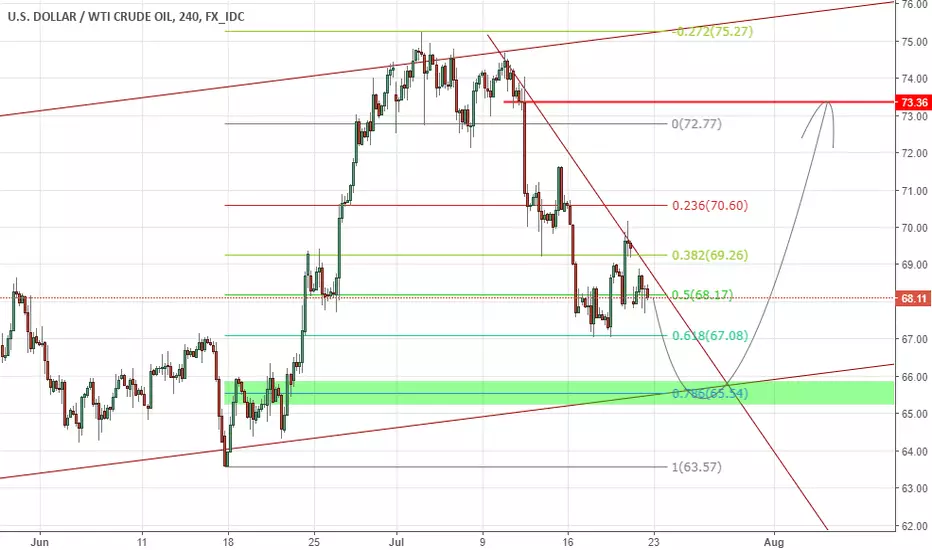
Crude Oil Fib LevelLast week Crude Oil sentiment was a bearish one. Looking at the chart, we can expect a continuation of bearish sentiment going into next week. Perhaps on the latter part of the week, we could reach demand level; Therefore we expect price to push back to $73 in the following week.
Have a great weekend, folks!
Cheers!
Will Crude Retrace its Surprise Gains?Crude made a surprise bounce on Wednesday, despite a big build in offical inventory data. There are some fundamentals that weighing on the supply side. However, on a technical level I feel we are now bearish in the short-term.
The two high volume areas are $68 and $71.
Price will react sharply at $69.50, and as such I'm looking for a test of $69.50, before a retrace back to $68 in the next 48 hours.
