Crude OilPair : Crude Oil
Description :
Completed " 12345 " Impulsive Waves and " A " Corrective Waves
Break of Structure and Retracement
Fibonacci Level - 50.00% / 61.80%
RSI - Divergence
Bullish Channel as an Corrective Pattern in Short Time Frame
Crude

CRUDE OIL (WTI): Important Decision Ahead 🛢️
Crude Oil is currently testing a wide horizontal supply area.
Its bullish breakout may trigger a strong bullish movement.
Daily candle close above 80.8 will confirm a violation.
A bullish continuation will be expected to 82.4 level then.
❤️Please, support my work with like, thank you!❤️

WTI Oil H1 | Approaching pullback supportWTI oil (USOUSD) is falling towards a pullback support and could potentially bounce off this level to rise towards our take-profit target.
Entry: 79.694
Why we like it:
There is a pullback support that aligns close to the 38.2% Fibonacci retracement level
Stop Loss: 79.048
Why we like it:
There is a pullback support that aligns with the 38.2% Fibonacci retracement level
Take Profit: 80.963
Why we like it:
There is a pullback resistance level
Please be advised that the information presented on TradingView is provided to Vantage (‘Vantage Global Limited’, ‘we’) by a third-party provider (‘Everest Fortune Group’). Please be reminded that you are solely responsible for the trading decisions on your account. There is a very high degree of risk involved in trading. Any information and/or content is intended entirely for research, educational and informational purposes only and does not constitute investment or consultation advice or investment strategy. The information is not tailored to the investment needs of any specific person and therefore does not involve a consideration of any of the investment objectives, financial situation or needs of any viewer that may receive it. Kindly also note that past performance is not a reliable indicator of future results. Actual results may differ materially from those anticipated in forward-looking or past performance statements. We assume no liability as to the accuracy or completeness of any of the information and/or content provided herein and the Company cannot be held responsible for any omission, mistake nor for any loss or damage including without limitation to any loss of profit which may arise from reliance on any information supplied by Everest Fortune Group.


CRUDE OIL Bullish Breakout! Buy!
Hello,Traders!
CRUDE OIL broke a strong
Key horizontal level of 79.61$
And the breakout is confirmed
So we are now bullish biased
And I will be expecting
A further bullish continuation
Buy!
Like, comment and subscribe to help us grow!
Check out other forecasts below too!

WTI Oil H1 | Potential bullish bounceWTI oil (USOIL) could fall towards a pullback support and potentially bounce off this level to climb higher.
Buy entry is at 77.912 which is an overlap support.
Stop loss is at 77.000 which is a level that lies underneath a pullback support and the 50.0% Fibonacci retracement level.
Take profit is at 79.523 which is a pullback resistance.
High Risk Investment Warning
Trading Forex/CFDs on margin carries a high level of risk and may not be suitable for all investors. Leverage can work against you.
Stratos Markets Limited (www.fxcm.com):
CFDs are complex instruments and come with a high risk of losing money rapidly due to leverage. 66% of retail investor accounts lose money when trading CFDs with this provider. You should consider whether you understand how CFDs work and whether you can afford to take the high risk of losing your money.
Stratos Europe Ltd, previously FXCM EU Ltd (www.fxcm.com):
CFDs are complex instruments and come with a high risk of losing money rapidly due to leverage. 70% of retail investor accounts lose money when trading CFDs with this provider. You should consider whether you understand how CFDs work and whether you can afford to take the high risk of losing your money.
Stratos Trading Pty. Limited (www.fxcm.com):
Trading FX/CFDs carries significant risks. FXCM AU (AFSL 309763), please read the Financial Services Guide, Product Disclosure Statement, Target Market Determination and Terms of Business at www.fxcm.com
Stratos Global LLC (www.fxcm.com):
Losses can exceed deposits.
Please be advised that the information presented on TradingView is provided to FXCM (‘Company’, ‘we’) by a third-party provider (‘TFA Global Pte Ltd’). Please be reminded that you are solely responsible for the trading decisions on your account. There is a very high degree of risk involved in trading. Any information and/or content is intended entirely for research, educational and informational purposes only and does not constitute investment or consultation advice or investment strategy. The information is not tailored to the investment needs of any specific person and therefore does not involve a consideration of any of the investment objectives, financial situation or needs of any viewer that may receive it. Kindly also note that past performance is not a reliable indicator of future results. Actual results may differ materially from those anticipated in forward-looking or past performance statements. We assume no liability as to the accuracy or completeness of any of the information and/or content provided herein and the Company cannot be held responsible for any omission, mistake nor for any loss or damage including without limitation to any loss of profit which may arise from reliance on any information supplied by TFA Global Pte Ltd.
The speaker(s) is neither an employee, agent nor representative of FXCM and is therefore acting independently. The opinions given are their own, constitute general market commentary, and do not constitute the opinion or advice of FXCM or any form of personal or investment advice. FXCM neither endorses nor guarantees offerings of third-party speakers, nor is FXCM responsible for the content, veracity or opinions of third-party speakers, presenters or participants.

WTI OIL: Bearish more likely long term.WTI Oil is neutral on the 1W technical outlook (RSI = 51.426, MACD = -0.040, ADX = 21.884) as it is about to close the third straight week trading sideways on the 1W MA50. On this long term chart, we can clearly see that the price hasn't crossed over the R1 level (79.75) since November 13 2023. As long as it keeps closing the 1W candle under it, we are bearish aiming at the 1W MA200 (TP = 73.50), which has been the ultimate Support in tha past few years, closing all 1W candles above it (see the circles). If on the other hand the 1W candle closes over the R1 level, expect a 83.50 test of the Symmetrical Resistance and 1W MA100, which is a Resistance level only crossed once since December 2022.
The 1W RSI trend looks like October 2022 (over the RSI's MA), which was a pattern that was followed by a strong decline. Consequently, we will sell one more time if the 1W candle closes under the 1W MA200 and target near the S1 Zone (TP = 65.00).
## If you like our free content follow our profile to get more daily ideas. ##
## Comments and likes are greatly appreciated. ##

WTI Oil H1 | Potential bullish bounce off overlap supportWTI oil (USOUSD) is falling towards an overlap support and could potentially bounce off this level to rise towards our take-profit target.
Entry: 78.046
Why we like it:
There is an overlap support that aligns close to the 50.0% Fibonacci retracement level
Stop Loss: 77.322
Why we like it:
There is a pullback support that sits under the 61.8% Fibonacci retracement level
Take Profit: 79.694
Why we like it:
There is a swing-high resistance level
Please be advised that the information presented on TradingView is provided to Vantage (‘Vantage Global Limited’, ‘we’) by a third-party provider (‘Everest Fortune Group’). Please be reminded that you are solely responsible for the trading decisions on your account. There is a very high degree of risk involved in trading. Any information and/or content is intended entirely for research, educational and informational purposes only and does not constitute investment or consultation advice or investment strategy. The information is not tailored to the investment needs of any specific person and therefore does not involve a consideration of any of the investment objectives, financial situation or needs of any viewer that may receive it. Kindly also note that past performance is not a reliable indicator of future results. Actual results may differ materially from those anticipated in forward-looking or past performance statements. We assume no liability as to the accuracy or completeness of any of the information and/or content provided herein and the Company cannot be held responsible for any omission, mistake nor for any loss or damage including without limitation to any loss of profit which may arise from reliance on any information supplied by Everest Fortune Group.

CRUDE OIL Pair : Crude Oil
Description :
Bullish Channel as an Corrective Pattern in Short Time Frame and Rejection from Daily Resistance
RSI - Divergence
Break of Structure
Symmetrical Triangle as an Correction in Short Time Frame with the Breakout of Upper Trend Line

✅CRUDE OIL RESISTANCE AHEAD|SHORT🔥
✅CRUDE OIL is going up to retest a horizontal resistance of 79.63$
Which makes me locally bearish biased
And I think that we will see a pullback
And a move down from the level
Towards the target below at 77.50$
SHORT🔥
✅Like and subscribe to never miss a new idea!✅

Futures market backwardation suggests a sluggish outlookDefying our expectations, the West Texas Intermediate crude oil rose above $75 and began to form a rectangle pattern between $76.16 and $79.25 (following a breakdown of negotiations between Israel and Hamas). Currently, the USOIL is trading near the lower bound of this range, which also coincides with the 20-day SMA that acts as an alternative support level. On the daily timeframe, the MACD performed a bearish crossover, and RSI with Stochastic reversed to the downside. Simultaneously, the ADX continued lower, indicating a lack of any trend. Yet, despite that, the futures contracts continue to trade backward, which suggests the market’s sluggish outlook for the oil’s future price.
Illustration 1.01
Illustration 1.01 shows the USOIL’s daily chart and simple support/resistance levels.
Illustration 1.02
The MACD line and signal line performed a bearish crossover. However, they are still within the bullish area above the midpoint.
Technical analysis
Daily time frame = Neutral
Weekly time frame = Neutral
Please feel free to express your ideas and thoughts in the comment section.
DISCLAIMER: This analysis is not intended to encourage any buying or selling of any particular securities. Furthermore, it should not be a basis for taking any trade action by an individual investor or any other entity. Your own due diligence is highly advised before entering a trade.

A Renko Trading Strategy - Part 7Part 7: Some Examples of Analysis with Indicators
First, let’s look at some of the key indicators that are included in the charts. Regardless of the brick size (10,25, or 50), all charts will have the same configuration.
DEMA (12-period and 20-period) : These moving averages are designed to react more quickly to price changes than a traditional simple moving average (SMA). The 12-period DEMA is black, and the 20-period DEMA is red. We would look for the 12-period DEMA to cross above the 20-period as a potential bullish signal and below as a bearish signal. As you examine the charts going forward, pay close attention to these two when comparing them to the dynamics of the brick patterns.
SMA (20-period) with Blue Dots : This moving average is plotted with blue dots and provides a visual indication of the longer-term trend. It's smoother and slower to react to price changes compared to the DEMA.
WMA (9-period) on the 20-period SMA (Purple Line) : The WMA is used to confirm trends and reversals. When the WMA is above the SMA, it may indicate an uptrend, and vice versa for a downtrend.
In terms of support and resistance, Renko bricks make it easier to spot these levels as they smooth out minor price fluctuations. Support and resistance would be identified by areas where the price has repeatedly reversed direction.
When comparing the 12 and 20-period DEMA to the Renko bricks, look for areas where the DEMAs act as dynamic support or resistance to the price action indicated by the bricks. Similarly, the 20-period SMA and the 9-period WMA would be assessed for their interaction with the Renko bricks.
For breakout patterns, we would look for a consolidation of Renko bricks, indicated by a tight clustering of bricks without clear direction, followed by a breakout above or below this consolidation with a corresponding move in the moving averages.
Let’s identify any notable patterns or signals on the chart. We will look for:
Crossovers between the DEMAs
The relationship between the DEMAs and the Renko bricks
Potential support and resistance levels
Any consolidation patterns that might indicate breakout points
The Average Directional Index (ADX) is used to determine the strength of a trend. The value of 35 that is used is higher than the standard 20 or 25, which implies the reduced noise in Renko charts.
Here’s how you might interpret the ADX in conjunction with the DI lines:
Consolidation : If the ADX is dropping and has crossed below the 35 level, it may indicate that the trend strength is weakening, suggesting a period of consolidation or range-bound market.
ADX Below DI Lines : When the ADX drops below both the +DI (positive directional indicator) and -DI (negative directional indicator), it further suggests that neither buyers nor sellers are in control, reinforcing the consolidation signal.
Watching for a Trend Change : If after dropping, the ADX starts to turn upward while below the DI lines, it could be an early sign that a new trend is starting to form. The direction of the trend would be indicated by which DI line the ADX crosses. If it crosses the +DI, it may signal the start of an uptrend; if it crosses the -DI, a downtrend might be beginning.
To apply this to your Renko chart, you would look for periods where the ADX dips below 35 and pay attention to its direction relative to the DI lines. You'd also consider the brick color change on the Renko chart for confirmation of trend direction if the ADX starts to rise after the dip.
Keep in mind that technical indicators should not be used in isolation; they are more effective when used in conjunction with other analysis tools and techniques. Renko charts themselves filter out smaller price movements, so the ADX on a Renko chart might not react the same way as it would on a traditional candlestick chart.
Here's some ideas on how to analyze and correlate the given indicators to price action:
Renko Bricks : Renko charts focus on price changes that meet a minimum amount and filter out minor price movements, thus highlighting the trend over time. A 50-tick Renko chart will only print a new brick when the price moves by 50 ticks, thereby smoothing out minor fluctuations and making trends easier to spot. The 1-hour timeframe means that each brick represents an hour's worth of price movement.
Linear Regression Channel (1st and 2nd degree) : This tool is used to identify potential support and resistance levels and the overall trend direction. The 1st degree (linear) regression trendlines show the mean price movement, while the 2nd degree could show a parabolic trend which accounts for acceleration in price movement. The price often oscillates around the mean trendline, and deviations can be used to identify overbought or oversold conditions.
Double Exponential Moving Average (DEMA) 12 and 20 : The DEMA is a faster-moving average that reduces lag time compared to traditional moving averages. In your setup, the DEMA 12 would be more reactive to price changes, potentially serving as a short-term trend indicator, while the DEMA 20 could be used to confirm medium-term trends.
Simple Moving Average (SMA) 20 with 9 period Weighted Moving Average (WMA) : The SMA 20 is a common indicator for medium-term trend direction. When combined with the 9-period WMA, which gives more weight to recent prices, you could use crossovers between the two as potential buy/sell signals.
Stochastic Oscillators (5,3,3 and 50,3,3) : Stochastic oscillators compare the closing price of a commodity to its price range over a certain period. The 5,3,3 stochastic is a fast indicator that can signal short-term overbought or oversold conditions. The 50,3,3 stochastic, being much slower, could be used to assess the longer-term momentum of the market.
Average Directional Index (ADX) with the Directional Movement Index (DMI) : The ADX is used to measure the strength of a trend, whether up or down. The DMI includes both the Positive Directional Indicator (+DI) and Negative Directional Indicator (-DI), which help determine the trend direction. A rising ADX indicates a strong trend, while a falling ADX suggests a weakening trend.
When analyzing the chart, consider the following correlations and insights:
Renko and Regression Channel : Look for periods when the Renko bricks consistently stay on one side of the mean regression line. This could indicate a strong trend. If the price breaks through the regression channel, it might signal a potential reversal or a breakout.
DEMA, SMA, and WMA : Watch for crossovers between these moving averages. A crossover of the DEMA 12 above the SMA 20 and WMA might indicate a bullish short-term momentum, while a crossover below could signal bearish momentum.
Stochastic Oscillators : Look for divergence between the price and the stochastic oscillators. If the price makes new highs/lows but the stochastic does not confirm (known as a divergence), it could indicate a weakening trend.
ADX and DMI : If the ADX is rising and the +DI is above the -DI, the uptrend is strong; if the -DI is above the +DI, the downtrend is strong. If the ADX is falling, the trend is considered weak or the market may be ranging.
For trade setups, you might consider the following:
Long Entry : A new Renko brick in the direction of the trend, a bullish crossover in moving averages, the stochastic coming out of oversold territory, and a rising ADX with +DI above -DI.
Short Entry : A new Renko brick opposite the trend direction, a bearish crossover in moving averages, the stochastic coming out of overbought territory, and a rising ADX with -DI above +DI.
It's crucial to back test these indicators and their correlations with historical price data to validate their predictive power. Additionally, always manage risk appropriately, as indicators are not foolproof and should be used in conjunction with other forms of analysis and sound trading principles.
Part 8: Working Through Some Examples
to-follow

A Renko Trading Strategy - Part 6Part 6: How to Incorporate a Stop/Loss Strategy
Incorporating stop-loss strategies into trading using Renko charts and options involves careful consideration of market dynamics, the specific characteristics of options trading, and the unique aspects of Renko charts. Here are some approaches tailored to this trading strategy:
1. Setting Stop Losses Based on Renko Chart Reversal
Renko Brick Reversals : Since Renko charts are designed to filter out minor price movements, a reversal (change in brick color) can be a significant indicator. For options trading, consider setting a stop-loss order if there's a reversal that contradicts your position. For instance, if trading calls based on an uptrend indicated by Renko charts, a stop-loss could be triggered by the appearance of a certain number (e.g., two or three) of consecutive red bricks, signaling a potential downtrend.
Percentage of Option Value : Determine a percentage loss of the option's value that you're willing to tolerate (e.g., 30-50% of the premium paid). This approach requires monitoring the option's value relative to market movements and Renko chart signals.
2. Volatility-Based Stop Losses
Average True Range (ATR) Adjustments : Although traditional Renko charts do not incorporate time or volume, you can use an additional indicator like the Average True Range (ATR) of the underlying futures contract to set volatility-adjusted stop losses. This method involves setting a stop loss at a point where the option's underlying asset moves against your position by an amount that is significant based on recent volatility, indicating the trend might not be as strong as anticipated.
3. Time-Based Exits
Option Time Decay : For options, time decay (theta) is an important consideration. You might set a time-based stop-loss strategy where positions are evaluated for potential exit if there hasn't been favorable movement within a certain timeframe, considering the decay's impact on your option's value, especially as it approaches expiration.
4. Technical and Fundamental Stop Losses
Renko Chart Patterns : If your Renko charts show pattern breakouts or breakdowns (e.g., failure of a breakout pattern you traded on), use these as a basis for stop-loss orders.
Fundamental News: For commodities like crude oil, fundamental news (e.g., geopolitical events, supply changes) can dramatically impact prices. If such events occur and are likely to adversely affect your position, consider them as triggers for your stop-loss strategy.
5. Dynamic Stop Losses
Adjust According to Market Conditions: As market conditions change, regularly review and adjust your stop-loss levels. This dynamic approach ensures that your strategy remains aligned with the current market environment and Renko chart developments.
6. Mental Stop Losses
Disciplined Execution : While physical stop-loss orders placed with a broker are automatic, mental stop losses rely on the trader's discipline to execute a trade when certain conditions are met. This approach allows for flexibility in response to market conditions but requires strict adherence to predetermined exit criteria to be effective.
Conclusion
Creating stop-loss strategies for options trading based on Renko charts involves a blend of technical analysis, understanding of options' characteristics, and disciplined risk management. By combining Renko chart reversals, volatility adjustments, time-based considerations, and both technical and fundamental factors, traders can develop a comprehensive stop-loss strategy that protects against undue losses while allowing room for the natural ebb and flow of the markets. Regular review and adjustment of these strategies in response to market changes are crucial for maintaining their effectiveness.
Part 7: Some Examples of Analysis
to-follow

A Renko Trading Strategy - Part 5Part 5: Devising a Strategy Based on Buying Calls/Puts
When trading crude oil (CL) using options like puts or calls, the strategy involving Renko charts and pattern recognition can be finely tuned for option trading. The choice between puts and calls will depend on the identified trend and pattern signals across the three brick sizes. Here are scenarios that illustrate when to buy puts or calls based on the described strategy:
Scenario 1: Buying Calls
Signal : All three Renko charts (short-term, medium-term, long-term) show a clear uptrend with consecutive green bricks. The medium-term chart breaks out of a consolidation pattern upwards, and the short-term chart shows a reversal pattern from a minor pullback, indicating a continuation of the uptrend.
Action : Buy calls as the uptrend signals an expectation of higher prices ahead.
Example : If the long-term chart has been in a consistent uptrend, the medium-term chart shows a breakout, and the short-term chart indicates a reversal or continuation pattern, it suggests strong bullish momentum, making it an optimal time to buy calls.
Scenario 2: Buying Puts
Signal : All three charts indicate a downtrend with consecutive red bricks. A double top pattern appears on the short-term chart, suggesting a reversal from a minor rally within the downtrend. The medium-term chart starts trending downwards after a consolidation, aligning with the long-term downtrend.
Action : Buy puts as the combined signals suggest a continuation of the downtrend.
Example : After a brief rally indicated by a double top on the short-term chart, if both the medium and long-term charts reinforce a bearish outlook with consistent red bricks, it's an indication to buy puts, expecting the price to fall.
Scenario 3: Buying Calls on a Reversal
Signal : The long-term chart shows a downtrend, but the medium and short-term charts indicate a reversal pattern (e.g., an inverse head and shoulders or a double bottom). The medium-term chart starts showing green bricks, suggesting the beginning of an uptrend.
Action : Buy calls to capitalize on the early stages of a potential reversal and uptrend.
Example : Even if the long-term trend is down, a clear reversal pattern on the short and medium-term charts that aligns with an emerging uptrend suggests a shifting momentum, making it a strategic point to buy calls.
Scenario 4: Buying Puts on a Failing Rally
Signal : During an uptrend on the long-term chart, both the medium and short-term charts show a rally running out of steam, evidenced by a pattern of consolidation followed by a breakout to the downside on the medium-term chart, and a double top on the short-term chart.
Action : Buy puts as the failing rally suggests a potential short-term downtrend, even within a larger uptrend.
Example : If the long-term trend remains bullish but short-term indicators suggest a temporary reversal, buying puts can be a strategic move to profit from the expected downturn.
General Approach for Options Trading with Renko Charts:
Timing : Use short-term and medium-term charts for timing your entry into options trades. The short-term chart provides early signals, while the medium-term chart offers confirmation.
Direction : The long-term chart sets the overall direction for the trade. Even in a bullish long-term trend, short-term downtrends provide opportunities to buy puts, and vice versa.
Volatility : Consider the implied volatility of options before entering a trade. High volatility can increase option premiums, affecting the risk-reward ratio.
Expiration : Choose expiration dates that give the trade enough time to work out. Longer expirations for calls in an uptrend or puts in a downtrend can be beneficial, allowing the market trend to fully develop.
By aligning option buying strategies with Renko chart signals across different time frames, traders can enhance their ability to enter and exit trades with a higher probability of success, leveraging the clarity provided by Renko charts to navigate the volatility of the crude oil market.
When buying puts or calls for Crude Oil (CL) futures with an approach akin to trading futures contracts but aiming to mitigate risk, particularly concerning options' time decay and other unique characteristics, a strategic approach is crucial. There are several key strategies to consider:
1. Choose the Right Expiration
Time Horizon of Your Analysis: Align the expiration of the options with the time horizon of your market analysis. If your analysis based on Renko charts suggests a trend or reversal might play out over several weeks or months, consider options that expire at least 1-3 months beyond your anticipated trend reversal or continuation point. This buffer accommodates the time needed for the market to move in your favor while accounting for time decay.
Avoid Short-Term Expiries: Short-term options are more susceptible to time decay (theta). While they may be cheaper and offer higher leverage, they also require the market to move quickly in your favor. Given the nature of Renko charts to filter out minor fluctuations and focus on more significant trends, a medium to longer-term option is generally more aligned with this strategy.
2. Consider Implied Volatility (IV)
High IV: When IV is high, options premiums are more expensive, reflecting greater expected volatility. Buying options in high IV environments can be risky as you're paying a premium for the expected volatility. However, if your analysis strongly suggests a significant market move, this could still be profitable.
Low IV: Buying options when IV is low can be advantageous because the premiums will be cheaper, reducing the cost of entry. If the market moves in your favor and volatility increases, the value of your option could rise both due to the directional move and the increase in IV.
3. Delta and In-The-Money (ITM) Options
Delta : Consider the delta of the options. Delta close to 1 (for calls) or -1 (for puts) means the option price moves nearly in lockstep with the underlying asset, similar to owning the futures contract but with limited risk. Options with higher deltas are typically more expensive but less affected by time decay relative to their intrinsic value.
ITM Options: Buying ITM options can be a strategic choice for mimicking futures trading. ITM options have intrinsic value and behave more like the underlying asset, with a higher delta and less sensitivity to time decay (theta) compared to out-of-the-money (OTM) options.
4. Rolling Options
Strategy : To maintain a position in the market while managing time decay, consider rolling options. As the expiration date approaches and if your market outlook remains unchanged, you can sell the nearing expiration option and buy a further out expiration option. This strategy requires careful consideration of transaction costs and potential slippage but allows you to stay in the trade with a fresh time horizon.
5. Hedging and Risk Management
Diversify Expirations : Instead of buying all options with the same expiration, consider staggering expirations. This diversification can help manage risk if the market moves against your position in the short term.
Adjust Positions: Be prepared to adjust your position based on market movement and upcoming economic events. Use stop-loss orders or consider buying options with different strike prices to hedge your bets.
Conclusion
When treating options on Crude Oil futures like trading the futures themselves but with reduced risk, selecting the right expiration date is vital, taking into account your market outlook, time decay, and implied volatility. Medium to longer-term options with consideration for delta and ITM status can more closely mimic the behavior of trading futures while offering the risk mitigation benefits of options trading. Always incorporate risk management strategies and be prepared to adjust your positions as market conditions evolve.
Part 6: How to Incorporate a Stop/Loss Strategy
to-follow

A Renko Trading Strategy - Part 4Part 4: Incorporating Patterns with Strategy
Incorporating pattern recognition into a trading strategy using three different brick sizes for Renko charts can enhance decision-making by providing multiple perspectives on market momentum and trend reversals. Applying this to the WTI (CL) market, using short-term, medium-term, and long-term views with different brick sizes.
1. Short-term Brick Size (e.g., 10 ticks, 1min)
Entry Signal : Look for breakout patterns or reversal patterns like a double bottom or an inverse head and shoulders pattern. This brick size will be more sensitive to recent price movements, offering early entry points.
Confirmation : Use this chart to get an early indication of a trend change or to catch the beginning of a new trend. However, due to its sensitivity, it's essential to wait for confirmation from the medium-term chart to reduce the risk of false signals.
2. Medium-term Brick Size (e.g., 25 ticks, 1min)
Entry Signal : This chart size is great for confirming trends identified in the short-term chart. If the medium-term chart starts to show a series of green bricks after a reversal pattern in the short-term chart, it's a stronger signal that the trend is reversing.
Strategy : Use this chart to solidify your decision for entry. For example, if you notice a consolidation pattern that breaks out in the same direction as the short-term trend, it can be a good entry point. The medium-term chart helps in filtering out the noise and focusing on more sustainable trends.
3. Long-term Brick Size (e.g., 50 ticks, 1min)
Entry Signal : Long-term charts are excellent for identifying the overall market trend. A clear pattern of consecutive bricks (either uptrend or downtrend) can indicate a strong market direction.
Strategy : Use the long-term chart for setting the direction of your trades. Enter trades that align with the long-term trend for higher probability outcomes. The long-term trend can also serve as a backdrop for assessing the strength of medium-term signals.
Combining Signals for Entry
Confluence Entry: The strongest entry signals will occur when patterns or trends align across all three brick sizes. For example, if the short-term chart shows a reversal pattern, the medium-term chart begins to trend in that direction, and the long-term chart supports this with a consistent trend, it's a strong signal for entry.
Breakout Entry: A breakout from a consolidation pattern (rectangle) on the medium-term chart that is also supported by a long-term trend can be a robust entry signal. The short-term chart can be used to fine-tune the entry point, such as entering after a small pullback following the breakout.
Risk Management
Stop-Loss Orders : Place stop-loss orders based on patterns from the medium or long-term charts to give your trades more room to breathe while still protecting against significant losses.
Take-Profit Points: Set take-profit levels based on significant resistance or support levels identified in the long-term chart to capitalize on the overall market movement.
Example Scenario
Scenario : The long-term chart shows a steady uptrend with consecutive green bricks. The medium-term chart shows a breakout from a consolidation pattern, and the short-term chart shows a double bottom, indicating a potential reversal from a recent minor pullback.
Action : Enter a long position after the double bottom on the short-term chart, with the medium-term breakout providing additional confirmation. The long-term uptrend supports the overall bullish outlook.
Risk Management : Place a stop-loss below the most recent low on the medium-term chart and set a take-profit near a significant resistance level identified on the long-term chart.
Conclusion
By using Renko charts with three different brick sizes and recognizing patterns across these timeframes, traders can develop a nuanced and layered approach to entering the crude oil market. This strategy allows for early detection of trends, confirmation across multiple timescales, and robust risk management, leading to potentially more informed and strategic trading decisions.
Part 5: Devising a Strategy Based on Buying Calls/Puts
to-follow

WTI Oil H1 | Potential bullish bounceWTI oil (USOIL) is falling towards a pullback support and could potentially bounce off this level to climb higher.
Buy entry is at 75.867 which is a pullback support.
Stop loss is at 75.300 which is a level that lies underneath a pullback support and the 50.0% Fibonacci retracement level.
Take profit is at 77.329 which is a pullback resistance.
High Risk Investment Warning
Trading Forex/CFDs on margin carries a high level of risk and may not be suitable for all investors. Leverage can work against you.
Stratos Markets Limited (www.fxcm.com):
CFDs are complex instruments and come with a high risk of losing money rapidly due to leverage. 66% of retail investor accounts lose money when trading CFDs with this provider. You should consider whether you understand how CFDs work and whether you can afford to take the high risk of losing your money.
Stratos Europe Ltd, previously FXCM EU Ltd (www.fxcm.com):
CFDs are complex instruments and come with a high risk of losing money rapidly due to leverage. 70% of retail investor accounts lose money when trading CFDs with this provider. You should consider whether you understand how CFDs work and whether you can afford to take the high risk of losing your money.
Stratos Trading Pty. Limited (www.fxcm.com):
Trading FX/CFDs carries significant risks. FXCM AU (AFSL 309763), please read the Financial Services Guide, Product Disclosure Statement, Target Market Determination and Terms of Business at www.fxcm.com
Stratos Global LLC (www.fxcm.com):
Losses can exceed deposits.
Please be advised that the information presented on TradingView is provided to FXCM (‘Company’, ‘we’) by a third-party provider (‘TFA Global Pte Ltd’). Please be reminded that you are solely responsible for the trading decisions on your account. There is a very high degree of risk involved in trading. Any information and/or content is intended entirely for research, educational and informational purposes only and does not constitute investment or consultation advice or investment strategy. The information is not tailored to the investment needs of any specific person and therefore does not involve a consideration of any of the investment objectives, financial situation or needs of any viewer that may receive it. Kindly also note that past performance is not a reliable indicator of future results. Actual results may differ materially from those anticipated in forward-looking or past performance statements. We assume no liability as to the accuracy or completeness of any of the information and/or content provided herein and the Company cannot be held responsible for any omission, mistake nor for any loss or damage including without limitation to any loss of profit which may arise from reliance on any information supplied by TFA Global Pte Ltd.
The speaker(s) is neither an employee, agent nor representative of FXCM and is therefore acting independently. The opinions given are their own, constitute general market commentary, and do not constitute the opinion or advice of FXCM or any form of personal or investment advice. FXCM neither endorses nor guarantees offerings of third-party speakers, nor is FXCM responsible for the content, veracity or opinions of third-party speakers, presenters or participants.

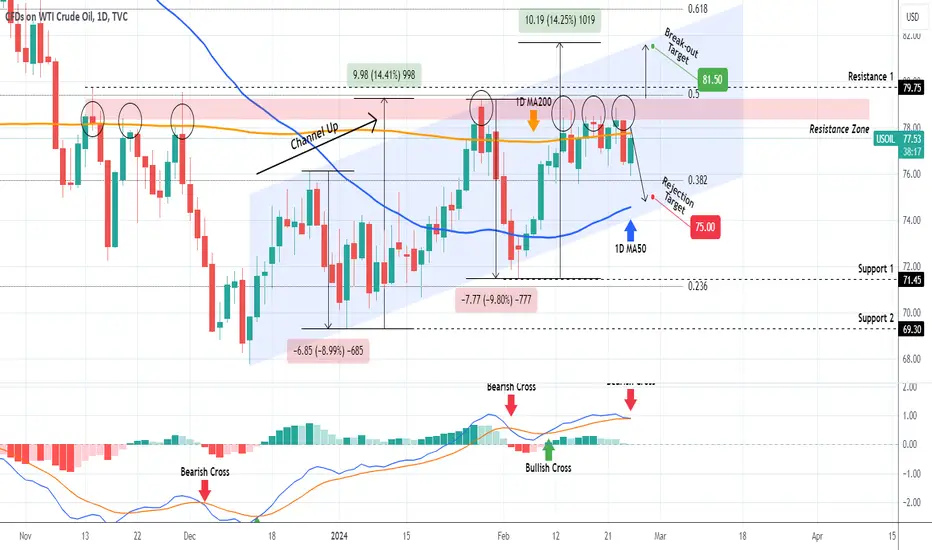
WTI OIL Is this a rejection?Almost 3 weeks ago (February 07, see chart below), we gave a strong buy signal on WTI Oil (USOIL), right at the bottom (Higher Lows trend-line) of the 2-month Channel Up:
The price is approaching the 81.50 target right at the top (Higher Highs trend-line) of the Channel Up. Since however we see a strong Resistance Zone that has been holding since the previous Higher High of the pattern, there is a very high probability for a pull-back, until it breaks. In fact, this Resistance Zone goes back to the November 14 2023 High (Resistance 1), with numerous rejections since.
As a result, we will only buy again after a 1D candle closes above the Resistance Zone, in which case we will pursue the 81.50 Target. Until then, we regard the recent rejection as a sell signal and we target the 1D MA50 (blue trend-line) and bottom of the Channel Up at 75.00.
-------------------------------------------------------------------------------
** Please LIKE 👍, FOLLOW ✅, SHARE 🙌 and COMMENT ✍ if you enjoy this idea! Also share your ideas and charts in the comments section below! This is best way to keep it relevant, support us, keep the content here free and allow the idea to reach as many people as possible. **
-------------------------------------------------------------------------------
💸💸💸💸💸💸
👇 👇 👇 👇 👇 👇
BRN - CRUDE OIL Short opportunity📉 Breaking News: BRN Crude Oil Faces Bearish Pressure Amidst Global Uncertainty
Interest Rate Concerns: Federal Reserve Governor Christopher Waller’s recent comments hinting at delayed interest rate cuts have raised concerns about sluggish economic growth. As a result, oil demand is expected to be curbed, impacting BRN crude prices
Pipeline Shortage in Canada: Canadian oil production is poised to hit a record high of 5.3 million barrels daily, straining the country’s pipeline network. This excess supply is contributing to the bearish sentiment.
Remember, the oil market is as volatile as ever, and unexpected twists can sway prices in either direction. Keep an eye on the news and consider diversifying your portfolio to mitigate risks during these uncertain times. 🛢️💸
Disclaimer: This post is for informational purposes only and does not constitute financial advice. Always consult with a professional before making investment decisions.

a weekly price action market recap and outlook - oilwti crude oil
The chart and my drawn wave outlook is the low probability thesis. More probable is a continuation of the trading range 68-78 or 70-80, whatever price you find more appealing, same outcome.
bull case: Bulls still prevented bears from a strong move down, as they had the last months, after a rally and we are still trading above the daily 20ema. We formed a trading range after the bull spike and i adjusted the lower wedge trend line which could hold but for that, bulls need to start the week strong and have immediate follow through. They still want to trade to 80 and touch the upper bear trend line which has started 2022-03.
bear case: Bears see a good looking bear bar from Friday and want follow through selling on Monday to get back below the daily 20ema. If they can break the ema and the bull wedge trend line, they have a good chance of a reversal back down to 70.
outlook last week: “sideways to up - invalid below 75”
→ Last Sunday we traded 78.46 and now we are at 76.49. the week was mostly sideways. if bears can push below 75 i say i was wrong but so far oil is above the important support prices
short term: slight favor for the bulls to reverse Friday and trade above 79, there could still be resistance if bulls won’t push above with some force. bears win below 75 for at least 74 or lower
medium-long term: same as last weeks. sideways inside the big triangle, above 80 odds favor bulls to get to the upper bear trend line around 82-84

CRUDE OIL Potential Short! Sell!
Hello,Traders!
CRUDE OIL has formed a
Bearish wedge pattern
And is now trying to
Make a bearish breakout
So we are bearish baised
And IF the breakout is confirmed
Then we can go short
Sell!
Like, comment and subscribe to help us grow!
Check out other forecasts below too!

WTI Oil H1 | Potential bullish bounceWTI oil (USOIL) could fall towards a pullback support and potentially bounce off this level to climb higher.
Buy entry is at 78.007 which is a pullback support.
Stop loss is at 76.200 which is a level that leis underneath a swing-low support.
Take profit is at 79.727 which is a pullback resistance.
High Risk Investment Warning
Trading Forex/CFDs on margin carries a high level of risk and may not be suitable for all investors. Leverage can work against you.
Stratos Markets Limited (www.fxcm.com):
CFDs are complex instruments and come with a high risk of losing money rapidly due to leverage. 66% of retail investor accounts lose money when trading CFDs with this provider. You should consider whether you understand how CFDs work and whether you can afford to take the high risk of losing your money.
Stratos Europe Ltd, previously FXCM EU Ltd (www.fxcm.com):
CFDs are complex instruments and come with a high risk of losing money rapidly due to leverage. 70% of retail investor accounts lose money when trading CFDs with this provider. You should consider whether you understand how CFDs work and whether you can afford to take the high risk of losing your money.
Stratos Trading Pty. Limited (www.fxcm.com):
Trading FX/CFDs carries significant risks. FXCM AU (AFSL 309763), please read the Financial Services Guide, Product Disclosure Statement, Target Market Determination and Terms of Business at www.fxcm.com
Stratos Global LLC (www.fxcm.com):
Losses can exceed deposits.
Please be advised that the information presented on TradingView is provided to FXCM (‘Company’, ‘we’) by a third-party provider (‘TFA Global Pte Ltd’). Please be reminded that you are solely responsible for the trading decisions on your account. There is a very high degree of risk involved in trading. Any information and/or content is intended entirely for research, educational and informational purposes only and does not constitute investment or consultation advice or investment strategy. The information is not tailored to the investment needs of any specific person and therefore does not involve a consideration of any of the investment objectives, financial situation or needs of any viewer that may receive it. Kindly also note that past performance is not a reliable indicator of future results. Actual results may differ materially from those anticipated in forward-looking or past performance statements. We assume no liability as to the accuracy or completeness of any of the information and/or content provided herein and the Company cannot be held responsible for any omission, mistake nor for any loss or damage including without limitation to any loss of profit which may arise from reliance on any information supplied by TFA Global Pte Ltd.
The speaker(s) is neither an employee, agent nor representative of FXCM and is therefore acting independently. The opinions given are their own, constitute general market commentary, and do not constitute the opinion or advice of FXCM or any form of personal or investment advice. FXCM neither endorses nor guarantees offerings of third-party speakers, nor is FXCM responsible for the content, veracity or opinions of third-party speakers, presenters or participants.

✅CRUDE OIL BEARISH BIAS|SHORT🔥
✅CRUDE OIL went up again
To retest the horizontal
Resistance of 79.61$ from
Where i believe we will see
A local bearish correction
SHORT🔥
✅Like and subscribe to never miss a new idea!✅

CRUDE OIL Bearish Breakout! Sell!
Hello,Traders!
CURDE OIL made a pullback
From the horizontal resistance
Level of 79$ and then broke
The rising support line
So we are locally bearish
Biased now and we will
Be expecting a move down
Buy!
Like, comment and subscribe to help us grow!
Check out other forecasts below too!
