WTI CRUDE OIL: Last pull to 4H MA50 possible, $72 target remainsWTI Crude Oil just turned bullish on its 1D technical outlook (RSI = 55.181, MACD = -0.570, ADX = 39.438) as it crossed above the 4H MA200. It is still under the 1D MA50, so the newly emerged Channel Up may pull the price back under the 4H MA50 one last time before the next, even stronger bullish wave. Overall, we remain long (TP = 72.00), even more so on the long term.
## If you like our free content follow our profile to get more daily ideas. ##
## Comments and likes are greatly appreciated. ##
Crude

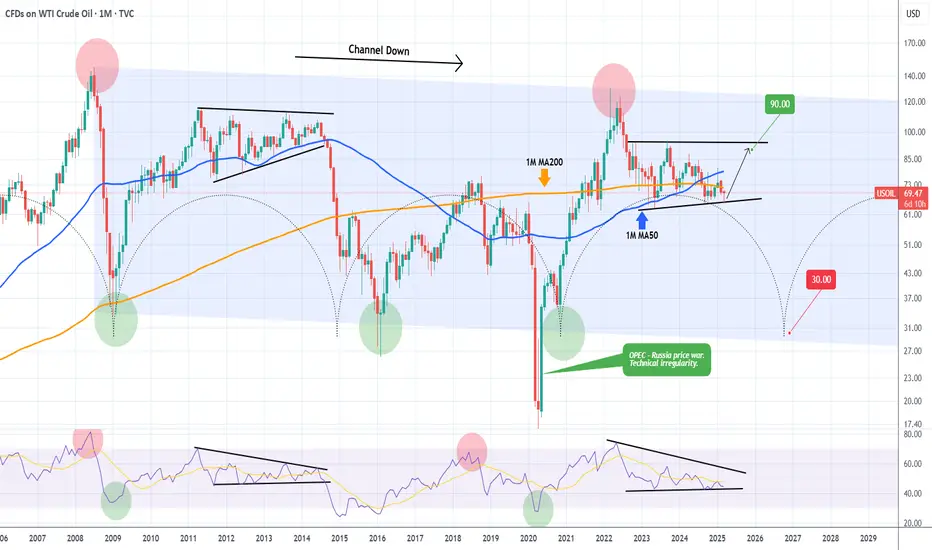
WTI OIL Ultimate long-term guide.WTI Oil (USOIL) has a tendency, like a number of key traditional assets, to follow long-term Cycles. Market psychology more times than not makes investors and the market behave in similar ways (euphoria buying, panic selling) given the same market conditions. Fundamentals and catalysts can often be used as reasons and excuses to confirm the technical trends and long-term Cycles.
Oil is no different and on this 1M time-frame analysis we see why. The dominant multi-year pattern is a Channel Down and it has started on the July 2008 All Time High (ATH). Right now it appears that we are inside a Wedge pattern similar to 2011 - 2014 and more specifically on the final Bullish Leg towards the top.
The 1M RSI sequence among those two fractals is identical so based on all these parameters we believe WTI will test $90.00 by late 2025 - early 2026 and if rejected, start a brutal long-term sell-off towards the bottom of the Channel Down and the 35.00 - 30.00 range by late 2026 as the Time Cycles suggest.
-------------------------------------------------------------------------------
** Please LIKE 👍, FOLLOW ✅, SHARE 🙌 and COMMENT ✍ if you enjoy this idea! Also share your ideas and charts in the comments section below! This is best way to keep it relevant, support us, keep the content here free and allow the idea to reach as many people as possible. **
-------------------------------------------------------------------------------
💸💸💸💸💸💸
👇 👇 👇 👇 👇 👇
Brent crude: We maintain our USD 65 to USD 85 range for the yearBrent crude's current momentum has taken prices to a three-week high, with the latest move being supported by a combination of underinvested hedge funds, improved risk sentiment following a softening in the tone regarding tariffs after Trump indicated some nations could receive breaks from "reciprocal" tariffs starting next week on 2 April, and not least, the mentioned secondary tariffs on buyers of Venezuelan crude, which, together with Iran sanctions, may help tighten supply.
Overall, we maintain our USD 65 to USD 85 range for the year, with the near-term upside potential being limited by resistance now seen in a band between USD 73.80, the 0.382 Fibonacci retracement of the January to March selloff, and USD 74.10, a level that provided support on several occasions last month before the eventual break triggered a slump extension to near USD 68.

WTI Oil H4 | Rising into 50% Fibonacci retracementWTI oil (USOIL) is rising towards a pullback resistance and could potentially reverse off this level to drop lower.
Sell entry is at 69.23 which is a pullback resistance that aligns with the 50.0% Fibonacci retracement.
Stop loss is at 70.70 which is a level that sits above the 61.8% Fibonacci retracement and a multi-swing-high resistance.
Take profit is at 66.44 which is a multi-swing-low support.
High Risk Investment Warning
Trading Forex/CFDs on margin carries a high level of risk and may not be suitable for all investors. Leverage can work against you.
Stratos Markets Limited (www.fxcm.com):
CFDs are complex instruments and come with a high risk of losing money rapidly due to leverage. 63% of retail investor accounts lose money when trading CFDs with this provider. You should consider whether you understand how CFDs work and whether you can afford to take the high risk of losing your money.
Stratos Europe Ltd (www.fxcm.com):
CFDs are complex instruments and come with a high risk of losing money rapidly due to leverage. 63% of retail investor accounts lose money when trading CFDs with this provider. You should consider whether you understand how CFDs work and whether you can afford to take the high risk of losing your money.
Stratos Trading Pty. Limited (www.fxcm.com):
Trading FX/CFDs carries significant risks. FXCM AU (AFSL 309763), please read the Financial Services Guide, Product Disclosure Statement, Target Market Determination and Terms of Business at www.fxcm.com
Stratos Global LLC (www.fxcm.com):
Losses can exceed deposits.
Please be advised that the information presented on TradingView is provided to FXCM (‘Company’, ‘we’) by a third-party provider (‘TFA Global Pte Ltd’). Please be reminded that you are solely responsible for the trading decisions on your account. There is a very high degree of risk involved in trading. Any information and/or content is intended entirely for research, educational and informational purposes only and does not constitute investment or consultation advice or investment strategy. The information is not tailored to the investment needs of any specific person and therefore does not involve a consideration of any of the investment objectives, financial situation or needs of any viewer that may receive it. Kindly also note that past performance is not a reliable indicator of future results. Actual results may differ materially from those anticipated in forward-looking or past performance statements. We assume no liability as to the accuracy or completeness of any of the information and/or content provided herein and the Company cannot be held responsible for any omission, mistake nor for any loss or damage including without limitation to any loss of profit which may arise from reliance on any information supplied by TFA Global Pte Ltd.
The speaker(s) is neither an employee, agent nor representative of FXCM and is therefore acting independently. The opinions given are their own, constitute general market commentary, and do not constitute the opinion or advice of FXCM or any form of personal or investment advice. FXCM neither endorses nor guarantees offerings of third-party speakers, nor is FXCM responsible for the content, veracity or opinions of third-party speakers, presenters or participants.

WTI CRUDE OIL: Hard rebound on 1.5 year support targeting $72.WTI Crude Oil is neutral on its 1D technical outlook (RSI = 48.748, MACD = -1.080, ADX = 23.603), which indicates the slow transition from a bearish trend to bullish. This started when the price hit the S1 level, a 1.5 year Support, and bottomed. The slow rebound that we're having since formed a Channel Up on a bullish 1D RSI, much like the one in September 2024, which eventually peaked after a +10.70% price increase. A similar rebound is expected to test the 1D MA200. The trade is long, TP = 72.00.
## If you like our free content follow our profile to get more daily ideas. ##
## Comments and likes are greatly appreciated. ##

CRUDE OIL Free Signal! Sell!
Hello,Traders!
CRUDE OIL made a sharp
And sudden move up
And it seems that it will
Soon hit a horizontal
Resistance level of 68.80$
From where we can go short
On Oil with the TP of 67.67$
And the SL of 68.87$
Sell!
Comment and subscribe to help us grow!
Check out other forecasts below too!
Disclosure: I am part of Trade Nation's Influencer program and receive a monthly fee for using their TradingView charts in my analysis.

CL1! Crude Oil Short TermTrump Letter Gave Iran Two-Month Deadline for Nuclear Deal
Intraday short term Entry+Prfofit Target
Sell1 Entry
Sell2-5 Incase missing the first entry or to cover

USOIL BREAKOUT FROM THE WEDGE|SHORT|
✅CRUDE OIL is trading in a
Downtrend and the price broke
Out of the bearish wedge pattern
And the breakout is confirmed
Because the 4H candle closed
Way below the wedge's support
So we are bearish biased and
We will be expecting a
Further bearish move down
SHORT🔥
✅Like and subscribe to never miss a new idea!✅
Disclosure: I am part of Trade Nation's Influencer program and receive a monthly fee for using their TradingView charts in my analysis.

WTI OIL turned the 4H MA50 into Support and aiming higher.WTI Oil (USOIL) has broken above the bearish trend of the former Lower Highs and a Channel Up emerged. The 4H MA50 (blue trend-line) broke for the first time in almost a month and has now been turned into Support.
As long as this holds, we expect Oil to target the 4H MA200 (orange trend-line) at $70.
-------------------------------------------------------------------------------
** Please LIKE 👍, FOLLOW ✅, SHARE 🙌 and COMMENT ✍ if you enjoy this idea! Also share your ideas and charts in the comments section below! This is best way to keep it relevant, support us, keep the content here free and allow the idea to reach as many people as possible. **
-------------------------------------------------------------------------------
Disclosure: I am part of Trade Nation's Influencer program and receive a monthly fee for using their TradingView charts in my analysis.
💸💸💸💸💸💸
👇 👇 👇 👇 👇 👇

WTI Oil H4 | Rising into an overlap resistanceWTI oil (USOIL) is rising towards an overlap resistance and could potentially reverse off this level to drop lower.
Sell entry is at 68.46 which is an overlap resistance that aligns with the 38.2% Fibonacci retracement.
Stop loss is at 70.70 which is a level that sits above the 61.8% Fibonacci retracement and a multi-swing-high resistance.
Take profit is at 65.20 which is a multi-swing-low support.
High Risk Investment Warning
Trading Forex/CFDs on margin carries a high level of risk and may not be suitable for all investors. Leverage can work against you.
Stratos Markets Limited (www.fxcm.com):
CFDs are complex instruments and come with a high risk of losing money rapidly due to leverage. 63% of retail investor accounts lose money when trading CFDs with this provider. You should consider whether you understand how CFDs work and whether you can afford to take the high risk of losing your money.
Stratos Europe Ltd (www.fxcm.com):
CFDs are complex instruments and come with a high risk of losing money rapidly due to leverage. 63% of retail investor accounts lose money when trading CFDs with this provider. You should consider whether you understand how CFDs work and whether you can afford to take the high risk of losing your money.
Stratos Trading Pty. Limited (www.fxcm.com):
Trading FX/CFDs carries significant risks. FXCM AU (AFSL 309763), please read the Financial Services Guide, Product Disclosure Statement, Target Market Determination and Terms of Business at www.fxcm.com
Stratos Global LLC (www.fxcm.com):
Losses can exceed deposits.
Please be advised that the information presented on TradingView is provided to FXCM (‘Company’, ‘we’) by a third-party provider (‘TFA Global Pte Ltd’). Please be reminded that you are solely responsible for the trading decisions on your account. There is a very high degree of risk involved in trading. Any information and/or content is intended entirely for research, educational and informational purposes only and does not constitute investment or consultation advice or investment strategy. The information is not tailored to the investment needs of any specific person and therefore does not involve a consideration of any of the investment objectives, financial situation or needs of any viewer that may receive it. Kindly also note that past performance is not a reliable indicator of future results. Actual results may differ materially from those anticipated in forward-looking or past performance statements. We assume no liability as to the accuracy or completeness of any of the information and/or content provided herein and the Company cannot be held responsible for any omission, mistake nor for any loss or damage including without limitation to any loss of profit which may arise from reliance on any information supplied by TFA Global Pte Ltd.
The speaker(s) is neither an employee, agent nor representative of FXCM and is therefore acting independently. The opinions given are their own, constitute general market commentary, and do not constitute the opinion or advice of FXCM or any form of personal or investment advice. FXCM neither endorses nor guarantees offerings of third-party speakers, nor is FXCM responsible for the content, veracity or opinions of third-party speakers, presenters or participants.

WTI OIL Massive 4-year Support hit. Bullish reversal ahead??WTI Oil (USOIL) hit on last week's 1W candle the 1M MA100 (red trend-line), a massive long-term Support level that has been holding since the week of April 26 2021, i.e. almost 4 years.
At the same time, the price entered the 2-year Support Zone, which has produced all major Bullish Phases (green Rectangles) during this time span. The last one got rejected twice on the 1W MA200 (orange trend-line).
Given the fact that this most recent rejection formed the current 2-month Bearish Phase (red Rectangle), which even based on 1W RSI terms, is similar to all previous Bearish Phases that found Support on the 2-year Support Zone, we have a massive long-term Support Cluster in front of us.
Naturally, until the 1W MA200 breaks, that should be the first Target of any buy attempts. As a result, we expect $80.00 to be tested by June 2025 the earliest.
-------------------------------------------------------------------------------
** Please LIKE 👍, FOLLOW ✅, SHARE 🙌 and COMMENT ✍ if you enjoy this idea! Also share your ideas and charts in the comments section below! This is best way to keep it relevant, support us, keep the content here free and allow the idea to reach as many people as possible. **
-------------------------------------------------------------------------------
Disclosure: I am part of Trade Nation's Influencer program and receive a monthly fee for using their TradingView charts in my analysis.
💸💸💸💸💸💸
👇 👇 👇 👇 👇 👇

WTI Oil H4 | Overhead pressures remain in place?WTI oil (USOIL) is rising towards an overlap resistance and could potentially reverse off this level to drop lower.
Sell entry is at 68.46 which is an overlap resistance that aligns with the 38.2% Fibonacci retracement.
Stop loss is at 70.70 which is a level that sits above the 61.8% Fibonacci retracement and a multi-swing-high resistance.
Take profit is at 65.20 which is a swing-low support.
High Risk Investment Warning
Trading Forex/CFDs on margin carries a high level of risk and may not be suitable for all investors. Leverage can work against you.
Stratos Markets Limited (www.fxcm.com):
CFDs are complex instruments and come with a high risk of losing money rapidly due to leverage. 63% of retail investor accounts lose money when trading CFDs with this provider. You should consider whether you understand how CFDs work and whether you can afford to take the high risk of losing your money.
Stratos Europe Ltd (www.fxcm.com):
CFDs are complex instruments and come with a high risk of losing money rapidly due to leverage. 63% of retail investor accounts lose money when trading CFDs with this provider. You should consider whether you understand how CFDs work and whether you can afford to take the high risk of losing your money.
Stratos Trading Pty. Limited (www.fxcm.com):
Trading FX/CFDs carries significant risks. FXCM AU (AFSL 309763), please read the Financial Services Guide, Product Disclosure Statement, Target Market Determination and Terms of Business at www.fxcm.com
Stratos Global LLC (www.fxcm.com):
Losses can exceed deposits.
Please be advised that the information presented on TradingView is provided to FXCM (‘Company’, ‘we’) by a third-party provider (‘TFA Global Pte Ltd’). Please be reminded that you are solely responsible for the trading decisions on your account. There is a very high degree of risk involved in trading. Any information and/or content is intended entirely for research, educational and informational purposes only and does not constitute investment or consultation advice or investment strategy. The information is not tailored to the investment needs of any specific person and therefore does not involve a consideration of any of the investment objectives, financial situation or needs of any viewer that may receive it. Kindly also note that past performance is not a reliable indicator of future results. Actual results may differ materially from those anticipated in forward-looking or past performance statements. We assume no liability as to the accuracy or completeness of any of the information and/or content provided herein and the Company cannot be held responsible for any omission, mistake nor for any loss or damage including without limitation to any loss of profit which may arise from reliance on any information supplied by TFA Global Pte Ltd.
The speaker(s) is neither an employee, agent nor representative of FXCM and is therefore acting independently. The opinions given are their own, constitute general market commentary, and do not constitute the opinion or advice of FXCM or any form of personal or investment advice. FXCM neither endorses nor guarantees offerings of third-party speakers, nor is FXCM responsible for the content, veracity or opinions of third-party speakers, presenters or participants.

WTI CRUDE OIL: 4H Channel Down targeting 64.00WTI Crude Oil is almost oversold on its 1D technical outlook (RSI = 33.014, MACD = -1.680, ADX = 27.887) but on the lower 4h timeframe its formed a Channel Down that just completed a peak formation. This indicates that it is ready for its next bearish wave, with the previous two registering -6.55% declines. The trade is short, TP = 64.00.
## If you like our free content follow our profile to get more daily ideas. ##
## Comments and likes are greatly appreciated. ##

WTI Oil H4 | Rising into overlap resistanceWTI oil (USOIL) is rising towards an overlap resistance and could potentially reverse off this level to drop lower.
Sell entry is at 68.46 which is an overlap resistance that aligns with the 38.2% Fibonacci retracement level.
Stop loss is at 70.70 which is a level that sits above the 61.8% Fibonacci retracement and a multi-swing-high resistance.
Take profit is at 65.20 which is a swing-low support.
High Risk Investment Warning
Trading Forex/CFDs on margin carries a high level of risk and may not be suitable for all investors. Leverage can work against you.
Stratos Markets Limited (www.fxcm.com):
CFDs are complex instruments and come with a high risk of losing money rapidly due to leverage. 63% of retail investor accounts lose money when trading CFDs with this provider. You should consider whether you understand how CFDs work and whether you can afford to take the high risk of losing your money.
Stratos Europe Ltd (www.fxcm.com):
CFDs are complex instruments and come with a high risk of losing money rapidly due to leverage. 63% of retail investor accounts lose money when trading CFDs with this provider. You should consider whether you understand how CFDs work and whether you can afford to take the high risk of losing your money.
Stratos Trading Pty. Limited (www.fxcm.com):
Trading FX/CFDs carries significant risks. FXCM AU (AFSL 309763), please read the Financial Services Guide, Product Disclosure Statement, Target Market Determination and Terms of Business at www.fxcm.com
Stratos Global LLC (www.fxcm.com):
Losses can exceed deposits.
Please be advised that the information presented on TradingView is provided to FXCM (‘Company’, ‘we’) by a third-party provider (‘TFA Global Pte Ltd’). Please be reminded that you are solely responsible for the trading decisions on your account. There is a very high degree of risk involved in trading. Any information and/or content is intended entirely for research, educational and informational purposes only and does not constitute investment or consultation advice or investment strategy. The information is not tailored to the investment needs of any specific person and therefore does not involve a consideration of any of the investment objectives, financial situation or needs of any viewer that may receive it. Kindly also note that past performance is not a reliable indicator of future results. Actual results may differ materially from those anticipated in forward-looking or past performance statements. We assume no liability as to the accuracy or completeness of any of the information and/or content provided herein and the Company cannot be held responsible for any omission, mistake nor for any loss or damage including without limitation to any loss of profit which may arise from reliance on any information supplied by TFA Global Pte Ltd.
The speaker(s) is neither an employee, agent nor representative of FXCM and is therefore acting independently. The opinions given are their own, constitute general market commentary, and do not constitute the opinion or advice of FXCM or any form of personal or investment advice. FXCM neither endorses nor guarantees offerings of third-party speakers, nor is FXCM responsible for the content, veracity or opinions of third-party speakers, presenters or participants.

WTI Oil H4 | Strong bearish momentumWTI oil (USOIL) is rising towards an overlap resistance and could potentially reverse off this level to drop lower.
Sell entry is at 68.46 which is an overlap resistance that aligns close to a 38.2% Fibonacci retracement and could potentially reverse off this level to drop lower.
Stop loss is at 70.70 which is a level that sits above the 61.8% Fibonacci retracement and a multi-swing-high resistance.
Take profit is at 65.20 which is a swing-low support.
High Risk Investment Warning
Trading Forex/CFDs on margin carries a high level of risk and may not be suitable for all investors. Leverage can work against you.
Stratos Markets Limited (www.fxcm.com):
CFDs are complex instruments and come with a high risk of losing money rapidly due to leverage. 63% of retail investor accounts lose money when trading CFDs with this provider. You should consider whether you understand how CFDs work and whether you can afford to take the high risk of losing your money.
Stratos Europe Ltd (www.fxcm.com):
CFDs are complex instruments and come with a high risk of losing money rapidly due to leverage. 63% of retail investor accounts lose money when trading CFDs with this provider. You should consider whether you understand how CFDs work and whether you can afford to take the high risk of losing your money.
Stratos Trading Pty. Limited (www.fxcm.com):
Trading FX/CFDs carries significant risks. FXCM AU (AFSL 309763), please read the Financial Services Guide, Product Disclosure Statement, Target Market Determination and Terms of Business at www.fxcm.com
Stratos Global LLC (www.fxcm.com):
Losses can exceed deposits.
Please be advised that the information presented on TradingView is provided to FXCM (‘Company’, ‘we’) by a third-party provider (‘TFA Global Pte Ltd’). Please be reminded that you are solely responsible for the trading decisions on your account. There is a very high degree of risk involved in trading. Any information and/or content is intended entirely for research, educational and informational purposes only and does not constitute investment or consultation advice or investment strategy. The information is not tailored to the investment needs of any specific person and therefore does not involve a consideration of any of the investment objectives, financial situation or needs of any viewer that may receive it. Kindly also note that past performance is not a reliable indicator of future results. Actual results may differ materially from those anticipated in forward-looking or past performance statements. We assume no liability as to the accuracy or completeness of any of the information and/or content provided herein and the Company cannot be held responsible for any omission, mistake nor for any loss or damage including without limitation to any loss of profit which may arise from reliance on any information supplied by TFA Global Pte Ltd.
The speaker(s) is neither an employee, agent nor representative of FXCM and is therefore acting independently. The opinions given are their own, constitute general market commentary, and do not constitute the opinion or advice of FXCM or any form of personal or investment advice. FXCM neither endorses nor guarantees offerings of third party speakers, nor is FXCM responsible for the content, veracity or opinions of third-party speakers, presenters or participants.

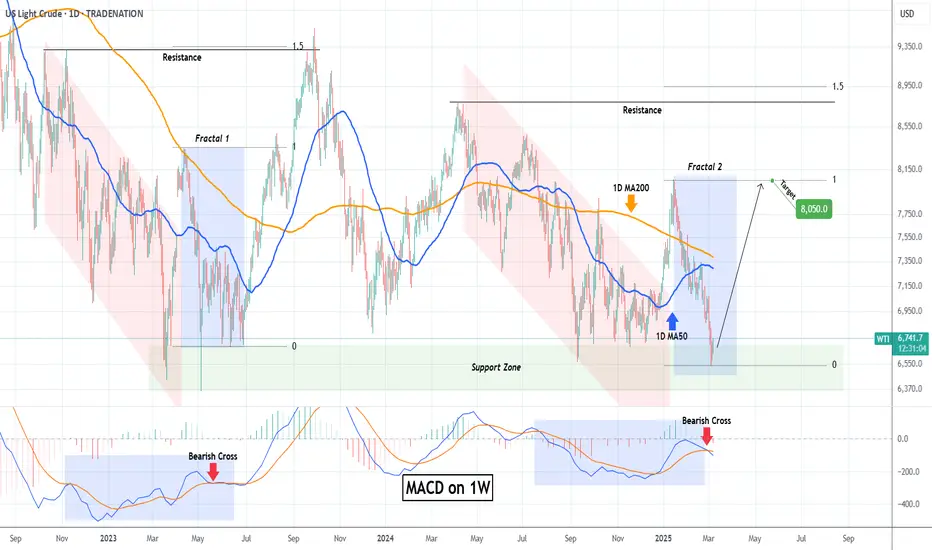
WTI OIL hit its 2-year Support. Major rebound possible.WTI Oil (USOIL) didn't fail us on our last bearish idea (February 20, see chart below), where we called the 1D MA50 rejection:
The decline didn't just hit our $69.00 Target but also broke below the medium-term Channel Up and entered the 2-year Support Zone.
The long-term dynamics should gradually start emerging now and the principle parameter is that every time this Support Zone gets hit, WTI starts strong medium-term rallies.
Technically (even on 1W MACD terms), the decline since mid January is very similar with the one of mid April 2023. Both were produced after another Support Zone rebound and before that a long-term Channel Down (red) preceded them.
As a result, we expect a strong rebound for at least the next 2 months, which (as in the case of Fractal 1) should initially target at least January's High at $80.50.
-------------------------------------------------------------------------------
** Please LIKE 👍, FOLLOW ✅, SHARE 🙌 and COMMENT ✍ if you enjoy this idea! Also share your ideas and charts in the comments section below! This is best way to keep it relevant, support us, keep the content here free and allow the idea to reach as many people as possible. **
-------------------------------------------------------------------------------
Disclosure: I am part of Trade Nation's Influencer program and receive a monthly fee for using their TradingView charts in my analysis.
💸💸💸💸💸💸
👇 👇 👇 👇 👇 👇
CRUDE is looking weak. Price connection is expected#CRUDE #Analysis
Description
---------------------------------------------------------------
+ Crude has formed a nice descending triangle pattern and price has broken down the support line which formed over the years.
+ A clear breakdown from this support would push down the prices further.
+ Next target is 50-40$ range.
---------------------------------------------------------------
Enhance, Trade, Grow
---------------------------------------------------------------
Feel free to share your thoughts and insights. Don't forget to like and follow us for more trading ideas and discussions.
Best Regards,
VectorAlgo

WTI CRUDE OIL: Major bullish signal on 1W.WTI Crude Oil turned oversold on its 1D technical outlook (RSI = 30.839, MACD = -1.280, ADX = 30.692) as it entered the 2 year S1 Zone. This is where all major rebounds took place. In the meanwhile a 1W RSI below 40.000 (like now) has been the strongest buy signal in the same period of time. Buy and target the LH Zone (TP = 76.00).
## If you like our free content follow our profile to get more daily ideas. ##
## Comments and likes are greatly appreciated. ##

WTI Oil H1 | Strong overhead pressuresWTI oil (USOIL) is rising towards an overlap resistance and could potentially reverse off this level to drop lower.
Sell entry is at 68.46 which is an overlap resistance that aligns with the 50.0% Fibonacci retracement level.
Stop loss is at 69.40 which is a level that sits above the 61.8% Fibonacci retracement and an overlap resistance.
Take profit is at 66.82 which is a swing-low support.
High Risk Investment Warning
Trading Forex/CFDs on margin carries a high level of risk and may not be suitable for all investors. Leverage can work against you.
Stratos Markets Limited (www.fxcm.com):
CFDs are complex instruments and come with a high risk of losing money rapidly due to leverage. 63% of retail investor accounts lose money when trading CFDs with this provider. You should consider whether you understand how CFDs work and whether you can afford to take the high risk of losing your money.
Stratos Europe Ltd (www.fxcm.com):
CFDs are complex instruments and come with a high risk of losing money rapidly due to leverage. 63% of retail investor accounts lose money when trading CFDs with this provider. You should consider whether you understand how CFDs work and whether you can afford to take the high risk of losing your money.
Stratos Trading Pty. Limited (www.fxcm.com):
Trading FX/CFDs carries significant risks. FXCM AU (AFSL 309763), please read the Financial Services Guide, Product Disclosure Statement, Target Market Determination and Terms of Business at www.fxcm.com
Stratos Global LLC (www.fxcm.com):
Losses can exceed deposits.
Please be advised that the information presented on TradingView is provided to FXCM (‘Company’, ‘we’) by a third-party provider (‘TFA Global Pte Ltd’). Please be reminded that you are solely responsible for the trading decisions on your account. There is a very high degree of risk involved in trading. Any information and/or content is intended entirely for research, educational and informational purposes only and does not constitute investment or consultation advice or investment strategy. The information is not tailored to the investment needs of any specific person and therefore does not involve a consideration of any of the investment objectives, financial situation or needs of any viewer that may receive it. Kindly also note that past performance is not a reliable indicator of future results. Actual results may differ materially from those anticipated in forward-looking or past performance statements. We assume no liability as to the accuracy or completeness of any of the information and/or content provided herein and the Company cannot be held responsible for any omission, mistake nor for any loss or damage including without limitation to any loss of profit which may arise from reliance on any information supplied by TFA Global Pte Ltd.
The speaker(s) is neither an employee, agent nor representative of FXCM and is therefore acting independently. The opinions given are their own, constitute general market commentary, and do not constitute the opinion or advice of FXCM or any form of personal or investment advice. FXCM neither endorses nor guarantees offerings of third-party speakers, nor is FXCM responsible for the content, veracity or opinions of third-party speakers, presenters or participants.

So far, so good... WTI oil price continues to please the bears. So far, the our stance is unchanged, we remain somewhat bearish on the price of MARKETSCOM:OIL in the near-term. That said, certain criteria still need to be met for us to get comfortable with further declines, especially from the technical side. Let's dig in!
TVC:USOIL
Let us know what you think in the comments below.
Thank you.
74.2% of retail investor accounts lose money when trading CFDs with this provider. You should consider whether you understand how CFDs work and whether you can afford to take the high risk of losing your money. Past performance is not necessarily indicative of future results. The value of investments may fall as well as rise and the investor may not get back the amount initially invested. This content is not intended for nor applicable to residents of the UK. Cryptocurrency CFDs and spread bets are restricted in the UK for all retail clients.

Crude - Further downside expectedFollow up on this:
Price shot up to test the triangle trendline once again. Now the price is trading very close to a very strong support level.
Based on Elliott Waves, I expect this level to break to make a new low, at least till $58-$60. Since this is the last leg of correction, it is likely to be a sharp drop.

USOIL - Short Trade (28th Feb 2025)This is a short trade idea on Crude Oil.
Basically, i'm not convinced of this sudden rejection. This is just manipulation to me. I want to target the liquidity resting below. I think we are going downtown to a monthly sSIBI at around 57.
Liquidity and efficiency rules the market. Everything else is nonsense.
- R2F Trading

Crude Oil - The Manipulation of Trend LinesIn this example on Crude Oil I give some insight into how trendlines and traditional support & resistance theories may be used by "smart money" for the purposes of facilitating their positions via inducing liquidity.
Basically, trendlines are drawn along the highs or lows of price movements and help to identify the direction and strength of a trend. They serve as visual guidelines for traders, highlighting potential turning points or continuation patterns. Support and resistance levels are areas where the price historically finds a floor or ceiling, leading many market participants to place their entry and exit orders around these zones. Because these levels are based on historical price action, they hold significant psychological value among retail traders.
The Mechanism of Liquidity Manipulation
Liquidity Pools and Stop Loss Clusters:
Retail traders often cluster their stop losses near prominent support or resistance levels. Smart money is aware of these liquidity pools and can engineer price moves to trigger these stops. For example, by intentionally nudging the price through a known support level, institutional players can trigger a cascade of stop-loss orders. This “stop run” injects a burst of liquidity into the market, which can then be absorbed as positions are liquidated at less favorable prices for retail traders.
False Breakouts and Reversals:
Another common tactic involves creating false breakouts. A price move that breaks above a resistance level (or below a support level) might initially appear to signal a new trend. However, smart money can deliberately drive prices just past these technical barriers to trigger stop-loss orders and entry orders. Once sufficient liquidity is collected from the triggered orders, they may reverse the move. This reversal traps traders who anticipated a sustained breakout, leaving them with positions that quickly turn against them.
Exploiting Herd Behavior and Market Sentiment:
The widespread reliance on technical analysis means that many traders have similar expectations about where price will reverse or accelerate. This collective mindset, or herd behavior, creates predictable zones of liquidity. Smart money can capitalize on these self-fulfilling prophecies by anticipating the mass reaction around key trendlines and support/resistance levels. They use this insight to position themselves ahead of the crowd, executing large trades that move the market in their favor.
Strategic Benefits for Smart Money
By manipulating these common technical levels, smart money participants can:
Maximize Efficiency: Accumulate or distribute large positions with minimal market impact by tapping into pre-existing liquidity pools.
Control Market Direction: Influence short-term price movements to create advantageous conditions for larger trades.
Enhance Risk-Reward Profiles: Trigger stop losses at critical junctures, effectively reducing their own risk while capitalizing on forced exits from retail traders.
Conclusion
While trendlines and support/resistance are invaluable tools for assessing market structure and potential price movements, they also serve as instruments for liquidity manipulation by experienced market participants. The predictable nature of stop-loss placements and entry orders around these levels creates opportunities for smart money to trigger cascades of orders, generating liquidity in their favor. As a result, retail traders must be aware of these dynamics and consider them when planning their trades, acknowledging that what appears to be a genuine breakout may, in fact, be a carefully orchestrated move to capture liquidity.
This nuanced understanding highlights the double-edged nature of technical analysis tools in modern trading. By appreciating both their utility and potential for manipulation, traders can better navigate the complex interplay between market psychology and institutional strategy.
