Crude oil remains on a bearish pathOil prices have fallen noticeably since Trump’s last minute deal to delay tariffs. Yesterday’s rebound on Trump's "maximum pressure" plan for Iran has proven to be short-lived. The negative effect of a US-China trade war on demand, as well as rising global supplies, is what is holding back prices. Even if Trump hadn’t delayed tariffs on Mexico and Canada, when considering both supply and demand factors, the overall impact on crude oil prices may well have been limited anyway. In any event, oil prices extended their losses after the OPEC+ agreed to stick to its policy and raise output gradually from April. Prices have fallen further today on the back of the latest inventories report from the US. A big 8.7 million barrel build was reported, which surprised the market given only a 2.4m build was expected. Against a backdrop of rising OPEC+ supply and the potential for increased non-OPEC supply growth, mainly in the US, the crude oil forecast remains modestly bearish.
From a technical perspective, crude oil remains in a modest downtrend, with WTI consistently forming lower highs since September 2023. A brief breakout above this trend in January met strong resistance just below $80, pushing prices back under the trend line by month-end. With the bearish bias reaffirmed and WTI slipping below the 200-day moving average again, downside risks remain dominant.
In terms of support, the area between $70.00 to $70.70 marks a key battle ground. This is where the price of oil last staged a rally from at the back end of last year. If we see a bounce here, I will then look for that bounce to fade as prices come up to test some key resistance levels…
Key resistance levels to watch include the recently broken support at $72.50, the 200-day average at $74.30 and the psychologically significant $75.00 mark. The bearish trend line hovers around $76.00.
By Fawad Razaqzada, market analyst with FOREX.com
Crude

WTI CRUDE OIL Sell signal under the 1day MA50WTI Crude Oil / USOIL has tested and held the 1day MA50 for two straight days.
Today's volatile candle though suggests that one more test is possible and the last time we saw this pattern was in late April 2024.
The two patterns have similar 1day RSI fractals, so the sell trigger here is the 1day MA50.
If we cross under it, sell and target Support B at 69.00.
Previous chart:
Follow us, like the idea and leave a comment below!!

WTI CRUDE OIL: Bullish dirgence on 4H RSI points to $85.00WTI Crude Oil is neutral on its 1D technical outlook (RSI = 46.798, MACD = 0.400, ADX = 43.927) as it hit the 1D MA50 and so far it is holding it. The correction of the past 2 weeks has been significant but the 4H RSI is posting a bullish divergence on HL and we might be technically having a bottom like February 27th. We anticipate an identical +18% rise (TP = 85.00).
## If you like our free content follow our profile to get more daily ideas. ##
## Comments and likes are greatly appreciated. ##

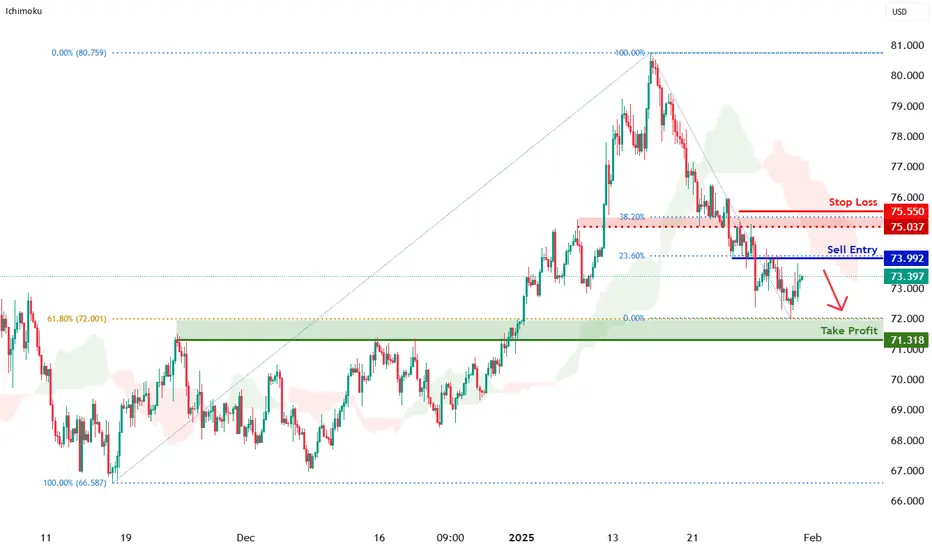
WTI Oil H4 | Bearish downtrend to extend further?WTI oil (USOIL) is rising towards an overlap resistance and could potentially reverse off this level to drop lower.
Sell entry is at 73.99 which is an overlap resistance that aligns with the 23.6% Fibonacci retracement.
Stop loss is at 75.55 which is a level that sits above the 38.2% Fibonacci retracement and an overlap resistance.
Take profit is at 71.31 which is a pullback support that aligns close to the 61.8% Fibonacci retracement.
High Risk Investment Warning
Trading Forex/CFDs on margin carries a high level of risk and may not be suitable for all investors. Leverage can work against you.
Stratos Markets Limited (www.fxcm.com):
CFDs are complex instruments and come with a high risk of losing money rapidly due to leverage. 63% of retail investor accounts lose money when trading CFDs with this provider. You should consider whether you understand how CFDs work and whether you can afford to take the high risk of losing your money.
Stratos Europe Ltd (www.fxcm.com):
CFDs are complex instruments and come with a high risk of losing money rapidly due to leverage. 63% of retail investor accounts lose money when trading CFDs with this provider. You should consider whether you understand how CFDs work and whether you can afford to take the high risk of losing your money.
Stratos Trading Pty. Limited (www.fxcm.com):
Trading FX/CFDs carries significant risks. FXCM AU (AFSL 309763), please read the Financial Services Guide, Product Disclosure Statement, Target Market Determination and Terms of Business at www.fxcm.com
Stratos Global LLC (www.fxcm.com):
Losses can exceed deposits.
Please be advised that the information presented on TradingView is provided to FXCM (‘Company’, ‘we’) by a third-party provider (‘TFA Global Pte Ltd’). Please be reminded that you are solely responsible for the trading decisions on your account. There is a very high degree of risk involved in trading. Any information and/or content is intended entirely for research, educational and informational purposes only and does not constitute investment or consultation advice or investment strategy. The information is not tailored to the investment needs of any specific person and therefore does not involve a consideration of any of the investment objectives, financial situation or needs of any viewer that may receive it. Kindly also note that past performance is not a reliable indicator of future results. Actual results may differ materially from those anticipated in forward-looking or past performance statements. We assume no liability as to the accuracy or completeness of any of the information and/or content provided herein and the Company cannot be held responsible for any omission, mistake nor for any loss or damage including without limitation to any loss of profit which may arise from reliance on any information supplied by TFA Global Pte Ltd.
The speaker(s) is neither an employee, agent nor representative of FXCM and is therefore acting independently. The opinions given are their own, constitute general market commentary, and do not constitute the opinion or advice of FXCM or any form of personal or investment advice. FXCM neither endorses nor guarantees offerings of third party speakers, nor is FXCM responsible for the content, veracity or opinions of third-party speakers, presenters or participants.

Crude OilUS Oil - Crude Oil
Bearish Channel as an corrective pattern in Short Time Frame
Break of Structure
RSI - Divergence
Completed " 12345 " Impulsive Waves and " A " Corrective Waves
Demand Zone

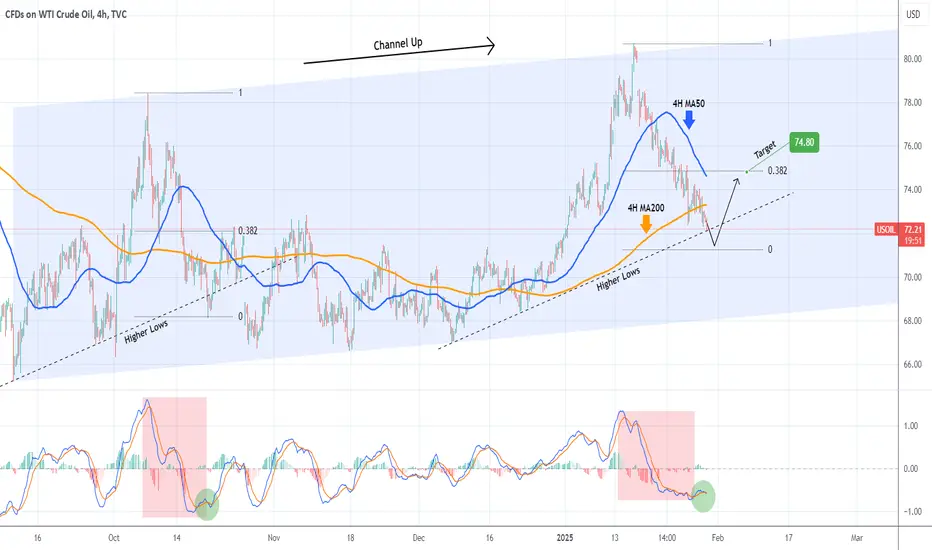
WTI OIL on a Bearish Leg but short-term rebound expected.WTI Oil (USOIL) has been trading within a Channel Up pattern that is unfolding its latest Bearish Leg. This Leg just hit the Higher Lows trend-line from the last bottom, which is so far no different than what took place during the previous Bearish Leg on October 18 2024.
The 4H MACD sequences among the two fractals are very similar so, as the October price action did, we expect a marginal breach of the Higher Lows followed by an instant rebound above the 4H MA50 (blue trend-line) and towards the 0.382 Fibonacci retracement level. As a result our short-term Target is $74.80.
-------------------------------------------------------------------------------
** Please LIKE 👍, FOLLOW ✅, SHARE 🙌 and COMMENT ✍ if you enjoy this idea! Also share your ideas and charts in the comments section below! This is best way to keep it relevant, support us, keep the content here free and allow the idea to reach as many people as possible. **
-------------------------------------------------------------------------------
💸💸💸💸💸💸
👇 👇 👇 👇 👇 👇
Crude Oil Is SandwichedPrice is currently between the white centerline and the long-term support/resistance level.
Since the price is near the centerline, we're seeing a kind of pullback to it. According to the Medianline framework, this is expected after trading below it.
The downside target would be the orange CL, as that aligns with the organic target. However, between the current price and the CL target, the long-term support level is quietly sitting there—possibly waiting to trap shorts.
What should a trader do now?
a) We could stay on the sidelines, observe, and learn.
b) We could go short, reasoning that the price is trading below the white CL and has made a textbook pullback to it. My stop would be placed above the orange bar that broke through the white CL.
A long position is not an option for me, as we are still below the white CL.
By the way: Look to the left and notice how the current situation mirrors past price action:
1. Break below the CL
2. Retest the CL
3. Move downward

CRUDE OIL Will Go UP! Buy!
Hello,Traders!
CRUDE OIL made a massive
10% bearish correction but
Then it hit a horizontal support
Of 72.89$ and a bullish rebound
Is already happening so we
Are bullish biased and we will
Be expecting a further move up
Buy!
Comment and subscribe to help us grow!
Check out other forecasts below too!

CRUDE OIL WILL GROW|LONG|
✅CRUDE OIL went down to retest a horizontal support of 73.00$
Which makes me locally bullish biased
And I think that a move up
From the level is to be expected
Towards the target above at 75.00$
LONG🚀
✅Like and subscribe to never miss a new idea!✅

Does WTI Oil have enough energy to travel back up?After an unsuccessful breakout in mid-January, MARKETSCOM:OIL made its move back down. That said, it's currently finding support near the 200-day EMA. On one hand, it may seem that this is the place for a potential rebound, however, the bulls should not get their hopes up, because there some indication for a possible drift further south. Take a look at the video idea.
TVC:USOIL
RISK DISCLAIMER
74.2% of retail investor accounts lose money when trading CFDs with this provider. You should consider whether you understand how CFDs work and whether you can afford to take the high risk of losing your money. Past performance is not necessarily indicative of future results. The value of investments may fall as well as rise and the investor may not get back the amount initially invested. This content is not intended for nor applicable to residents of the UK. Cryptocurrency CFDs and spread bets are restricted in the UK for all retail clients.

SELL USOILBeen a while since I last posted.
Today's trade is on OIL, you can sell and target the LQ zone I targeted and set the same SL as mine.
Follow for more!

Dollar down, Metals, Miners, Crude Up! SPX new high, Bitcoin???Premarket US dollar down while precious metals and mining stocks get a bid higher. SPX closes above 6118$ making new record high. Crude oil gets a minor bounce, can it retrace to $77? What is Bitcoin doing next? Will it close higher or sell off from here? That is the question.

WTI OIL Channel Up emerging, aiming at $90.WTI Oil (USOIL) recently broke above its 15-month Lower Highs trend-line that has been keeping it under a bearish trend and is now naturally pulling back. This technical pull-back is so far within the tolerance levels of a bullish trend.
The pattern that making use of this trend is a Channel Up, newly emerged and now about to test the 1D MA200 (orange trend-line) as a Support for the first time since August 14 2024. As long as it holds, we expect the new Bullish Leg to start and as with the Jan - Apr 2024 Channel Up, rise towards the 1.786 Fibonacci extension. Our Target is quite below it at $90.00.
-------------------------------------------------------------------------------
** Please LIKE 👍, FOLLOW ✅, SHARE 🙌 and COMMENT ✍ if you enjoy this idea! Also share your ideas and charts in the comments section below! This is best way to keep it relevant, support us, keep the content here free and allow the idea to reach as many people as possible. **
-------------------------------------------------------------------------------
💸💸💸💸💸💸
👇 👇 👇 👇 👇 👇

WTI CRUDE OIL: Buy opportunity on the bottom trendline.WTI Crude Oil remains bullish on its 1D technical outlook (RSI = 58.480, MACD = 1.830, ADX = 66.542) despite the 4 day selling streak, which pushed the price under the 4H MA50. The HL trendline is still intact though, so technically that is a sound buy opportunity, especially if the 1D RSI hits the 30.000 oversold level. We're bullish (TP = 86.00).
## If you like our free content follow our profile to get more daily ideas. ##
## Comments and likes are greatly appreciated. ##

WTI Oil H4 | Rising into overlap resistanceWTI oil (USOIL) is rising towards an overlap resistance and could potentially reverse off this level to drop lower.
Sell entry is at 77.20 which is an overlap resistance that aligns with the 38.2% Fibonacci retracement level.
Stop loss is at 78.77 which is a level that sits above the 61.8% Fibonacci retracement and a pullback resistance.
Take profit is at 74.85 which is a pullback support.
High Risk Investment Warning
Trading Forex/CFDs on margin carries a high level of risk and may not be suitable for all investors. Leverage can work against you.
Stratos Markets Limited (www.fxcm.com):
CFDs are complex instruments and come with a high risk of losing money rapidly due to leverage. 64% of retail investor accounts lose money when trading CFDs with this provider. You should consider whether you understand how CFDs work and whether you can afford to take the high risk of losing your money.
Stratos Europe Ltd (www.fxcm.com):
CFDs are complex instruments and come with a high risk of losing money rapidly due to leverage. 66% of retail investor accounts lose money when trading CFDs with this provider. You should consider whether you understand how CFDs work and whether you can afford to take the high risk of losing your money.
Stratos Trading Pty. Limited (www.fxcm.com):
Trading FX/CFDs carries significant risks. FXCM AU (AFSL 309763), please read the Financial Services Guide, Product Disclosure Statement, Target Market Determination and Terms of Business at www.fxcm.com
Stratos Global LLC (www.fxcm.com):
Losses can exceed deposits.
Please be advised that the information presented on TradingView is provided to FXCM (‘Company’, ‘we’) by a third-party provider (‘TFA Global Pte Ltd’). Please be reminded that you are solely responsible for the trading decisions on your account. There is a very high degree of risk involved in trading. Any information and/or content is intended entirely for research, educational and informational purposes only and does not constitute investment or consultation advice or investment strategy. The information is not tailored to the investment needs of any specific person and therefore does not involve a consideration of any of the investment objectives, financial situation or needs of any viewer that may receive it. Kindly also note that past performance is not a reliable indicator of future results. Actual results may differ materially from those anticipated in forward-looking or past performance statements. We assume no liability as to the accuracy or completeness of any of the information and/or content provided herein and the Company cannot be held responsible for any omission, mistake nor for any loss or damage including without limitation to any loss of profit which may arise from reliance on any information supplied by TFA Global Pte Ltd.
The speaker(s) is neither an employee, agent nor representative of FXCM and is therefore acting independently. The opinions given are their own, constitute general market commentary, and do not constitute the opinion or advice of FXCM or any form of personal or investment advice. FXCM neither endorses nor guarantees offerings of third-party speakers, nor is FXCM responsible for the content, veracity or opinions of third-party speakers, presenters or participants.

WTI CRUDE OIL This pull back is the best buy opportunityWTI Crude Oil is on the pull back after a Resistance Zone (1) rejection.
The Rising Support trend line is parallel to the MA50 (1d) and a 0.5 Fibonacci test would be the most effective buy entry.
So far this resembles the January 29th 2024 rejection.
Trading Plan:
1. Buy on the 0.5 Fib.
Targets:
1. 86.50 (Resistance Zone 2).
Tips:
1. The RSI (1d) also shows similarities with the Jan 29th 2024 rejection, supporting our expectation of a MA50 (1d) bounce.
Please like, follow and comment!!

#202503 - priceactiontds - weekly update - oilGood Evening and I hope you are well.
comment: 4th consecutive bullish weekly bar but the tails above are getting bigger (weekly chart). The volume is also increasing, which could be a sign of more participants thinking it’s a good time to scale into shorts and out of longs. If there would be a run on oil because macro reason xyz, volume would have been bigger already is what I reckon. Does not matter much though, because bears need to do more before we can turn more bearish. First decent pull-back will be bought, so it will most likely be better to look for longs after a pull-back than to try and pick the top.
current market cycle: trading range - on lower time frames it’s also obviously a bull trend
key levels: 77 - 81
bull case: Bulls are in full control and want to break above the 2024-04 high 80.03. We are close enough to expect market to get there soon. Problem for the bulls is, this rally is parabolic and unsustainable. The last time we printed 5 consecutive bull bars on the weekly chart was mid of 2023. For now we can’t expect to see bigger bearish price action because bulls have been making money buying every small dip.
Invalidation is below 76.
bear case: Bears have made the first lower high which now looks like an ugly head & shoulders. I think the odds of this breaking down for a measured move to sub 72 are very low. Much more likely is that bears would exit fast on another push up and try again to keep it below 80. The current lower bull channel line runs through 75ish and it’s reasonable to expect a bigger pull-back over the next 1-2 weeks.
Invalidation is above 80.
short term: Bullish for 80 and then looking to short for a bigger pull-back down to the bull channel. A strong close above 80 would change my mind.
medium-long term - Update from 2025-01-19: Triangle is dead and market is now in a proper trading range with upside to 80 or even 85. Trade the bull channel until it’s clearly broken again.
current swing trade: None
chart update: Added potential bear targets.

OUR TRADE TODAY ON OILToday, we took 3 trades, A profitable and 2 in loss.
I will share the 3 of them so I share with you the other side of trading with only few people show which is losses.
Our trade on OIL went as expected, but the other one on NASDAQ and GOLD didn't go as planned which left me and my clients with couple $ up. And that's normal since we're still in profit on the weekly and monthly basis.
Follow for more!

OUR TRADE TODAY ON USOILMy clients and I today too 2 trades, one on Oil and the other one on Nasdaq, we entered after that the market gave us a reversal point to target the liquidity level, which the market filled later in the day.
I didn't post it since we had to focus on recovering the losses silently, since we did, I'll be reposting again.
Follow for more!

WTI CRUDE OIL: Buy opportunity on the 1D MA50.WTI Crude Oil is neutralizing the previously overbought 1D technical outlook (RSI = 69.520, MACD = 2.080, ADX = 64.888) as after crossing over the R1 level, it is pulling back under it. Technically this has been mirroring the March-August 2023 fractal and based on that, we should see this pull back almost reach the 1D MA50. A buy opportunity is waiting there and our target is the 1.618 Fibonacci level (TP = 86.00).
See how our prior idea has worked out:
## If you like our free content follow our profile to get more daily ideas. ##
## Comments and likes are greatly appreciated. ##

Crude OIL Follow the plan Oil is one of the main tools that pressure the global economy. This tool is manually controlled; I will not repeat who owns it.
For the last 10 years, I have seen this pattern very often when we see a triangle that breaks down, but before it collects liquidity from above and breaks the upper resistance
I talked about it in a previous post
The idea is still the same; the timings are stretched longer.
I intend to pick up a historical start this year, most likely at the end of the year.
That's my lazy plan.
The realization is more complicated because opening a position at the ideal entry point will be challenging. All shorts will be liquidated and stop out for a long time, so we will probably have to stand in the reversal formation phase for a long time.
I could go on and on about politics and how it's explained to you on TV. But I don't do that.
Best regards EXCAVO

TP FILLED ON USOIL TRADEYesterday I posted to sell USOIL, and I didn't post about where to close since we didn't close at the target, instead we closed a bit higher after that the market swept a LQ at 77.399.
Follow for more daily trades!
