CRUDE OIL CORRECTION AHEAD|SHORT|
✅CRUDE OIL is about to retest a key structure level of 80.14$
Which implies a high likelihood of a move down
As some market participants will be taking profit from long positions
While others will find this price level to be good for selling
So as usual we will have a chance to ride the wave of a bearish correction
SHORT🔥
✅Like and subscribe to never miss a new idea!✅
Crude

CRUDE OIL Resistance Ahead! Sell!
Hello,Traders!
CRUDE OIL is trading in a
String uptrend but it is
Locally overbought as
After Oil hit the horizontal
Resistance level of 80.64$
We will be expecting a
Local bearish correction
Sell!
Comment and subscribe to help us grow!
Check out other forecasts below too!

SELL USOILGood morinng traders!
Our trade today is on OIL, we're selling after having the reversal confirmed by thge market to target our LQ level.
Follow for more!

Crude Oil breaks and follows projectionAfter the long consolidation time, CL finally broke the Trend-Barrier (TB) and is now on the move to the upside.
It's not stupid to aim for the 1/4 line as PTG1.
But for sure I would only close a portion of the position, since the upside potential is far higher.
And if you don't know how much to bank, just go with 50% of your investment. If it's going higher, you're still participating from the move.
If it goes sour, you have already banked 50%.
Just create a plan and follow it.

Quick Gains from Black Gold: A Short-Term Strategy for Oil🚀 Bullish Analysis for Crude Oil:
Current Price: 73.11 USD.
Support: The price is bouncing off the lower trend line of our ascending channel, acting like a solid floor! 🛑
RSI: At 39.10, we're not even halfway to overbought territory, plenty of room to climb! 📈
Entry: Buy now at 73.11 USD.
Take Profit Levels:
🎯 Take Profit 1: 73.60 USD
🎯 Take Profit 2: 74.25 USD
🏆 Take Profit 3: 75.00 USD
Stop Loss: Set your safety net at 72.40 USD, just below our support line. 🛡
This setup is not just good, it's electrifying! With a stop loss that's a safe distance away, you're setting up for a potential win with a solid risk-reward ratio. Let's ride this wave! 🌊

USOUSD (Oil) Key support follow up.Thanks for checking our latest update, and happy new year to all. Today, we have followed up on our last oil update. You can see this update on the link below.
The main topic of the last update was a key support area. The area held, and we saw a new rally develop. Today, we have looked at that rally and asked if it's going to break the long-term downtrend or if we could see price contnue to remain rangebound.
We see short-term resistance at $74.75 and short-term support at $73.20.
As always, traders must remain vigilant and stay abreast of the latest updates from OPEC and geopolitical influences, as these factors can significantly impact the market.
Good trading from Eightcap.

COLLECTED PROFITS ON TODAY'S TRADE ON USOILI posted earlier today to buy on USOIL | OIL | CL1!, We set a 1:2 trade but since today is a holiday and the markets are slow, we closed after that we have an equal high and the market swept them.
We had a wonderful trade in a closed market.
Follow for more!

WTI Oil H4 | Falling towards an overlap supportWTI oil (USOIL) is falling towards an overlap support and could potentially bounce off this level to climb higher.
Buy entry is at 72.65 which is an overlap support that aligns with the 38.2% Fibonacci retracement level.
Stop loss is at 71.20 which is a level that lies underneath a pullback support.
Take profit is at 74.85 which is a multi-swing-high resistance.
High Risk Investment Warning
Trading Forex/CFDs on margin carries a high level of risk and may not be suitable for all investors. Leverage can work against you.
Stratos Markets Limited (www.fxcm.com):
CFDs are complex instruments and come with a high risk of losing money rapidly due to leverage. 64% of retail investor accounts lose money when trading CFDs with this provider. You should consider whether you understand how CFDs work and whether you can afford to take the high risk of losing your money.
Stratos Europe Ltd (www.fxcm.com):
CFDs are complex instruments and come with a high risk of losing money rapidly due to leverage. 66% of retail investor accounts lose money when trading CFDs with this provider. You should consider whether you understand how CFDs work and whether you can afford to take the high risk of losing your money.
Stratos Trading Pty. Limited (www.fxcm.com):
Trading FX/CFDs carries significant risks. FXCM AU (AFSL 309763), please read the Financial Services Guide, Product Disclosure Statement, Target Market Determination and Terms of Business at www.fxcm.com
Stratos Global LLC (www.fxcm.com):
Losses can exceed deposits.
Please be advised that the information presented on TradingView is provided to FXCM (‘Company’, ‘we’) by a third-party provider (‘TFA Global Pte Ltd’). Please be reminded that you are solely responsible for the trading decisions on your account. There is a very high degree of risk involved in trading. Any information and/or content is intended entirely for research, educational and informational purposes only and does not constitute investment or consultation advice or investment strategy. The information is not tailored to the investment needs of any specific person and therefore does not involve a consideration of any of the investment objectives, financial situation or needs of any viewer that may receive it. Kindly also note that past performance is not a reliable indicator of future results. Actual results may differ materially from those anticipated in forward-looking or past performance statements. We assume no liability as to the accuracy or completeness of any of the information and/or content provided herein and the Company cannot be held responsible for any omission, mistake nor for any loss or damage including without limitation to any loss of profit which may arise from reliance on any information supplied by TFA Global Pte Ltd.
The speaker(s) is neither an employee, agent nor representative of FXCM and is therefore acting independently. The opinions given are their own, constitute general market commentary, and do not constitute the opinion or advice of FXCM or any form of personal or investment advice. FXCM neither endorses nor guarantees offerings of third-party speakers, nor is FXCM responsible for the content, veracity or opinions of third-party speakers, presenters or participants.

Crude oil Is Approaching ResistanceCrude oil is coming higher on 4h time frame, out of a wave B bullish triangle that we have been tracking through December. Well, we know that moves out of a triangle are final in a sequence, so we can expect limited upside, and ideally, this will cause the completion of wave E rally of a larger bearish triangle pattern. It's now approaching an important resistance at 74-75, its gap from mid-October, right at the upper side of a triangle. There is a chance for a turn soon.
A triangle appears to reflect a balance of forces, causing a sideways movement that is usually associated with decreasing volume and volatility. The triangle pattern contains five overlapping waves that subdivide 3-3-3-3-3 and are labeled A-B-C-D-E. It’s a region of horizontal price movement, a consolidation of a prior move, and it is composed of “threes.” That means each of the A-B-C-D-E waves have three subwaves. The triangle pattern is generally categorized as a continuation pattern, meaning that after the pattern completes, it’s assumed that the price will continue in the trend direction it was moving before the pattern appeared. However, triangles also indicate that the final leg is coming before a reversal and that’s why triangles are labeled in wave B, wave X or wave 4.

Crude Opportunity Part 2In this second part, the Crude Futures Daily chart is used.
In this chart, there are marked points where the SuperTrend Buy signal is triggered and is coincided by a green Rate of VolDiv (RoVD, bottom panel). There is one on 8 October but there was no comcomitant indication and clearly it "failed". The others that fulfilled the condition are marked with a yellow time line.
So clearly, the recent breakout is projected to have something similar in terms of a bullish rally.
This is in line with the weekly outlook.
Together with technical indicators like the RoVD, as well as the MACD where there is a clear breakout support, Crude appears to have much upside potential. However, there is no rush as it just met the trendline resistance and is expected to pull back a bit to retest and breakout again for the longer term.
Overall, this looks not like a spike out of fear, but one spurred by inflation. This is in the MUST WATCH list for sure and an accumulation plan should be in place.
A projected path is drawn as a guide and the target for Crude is 100-105.

Crude Opportunity Part 1Previously, heads up about BTCUSD and it was pretty spot-on.
Oddly enough, CRUDE OIL CL1! is next.
For the first part, here we look at the marked time lines, and the effect after these time lines. 5 of the last 6 times, saw a bullish rally. Of these, 4 of the 5 occasions had the Rate of VolDiv (custom indicator) trend changed for an uptick.
In essence, the current weekly Crude Oil Futures CL1! show a similar set up ready for a spike and rally for Crude Oil. No fundamental reason (yet) but the technicals are projecting a billish scenario based on the technical set up.
Part 2 will look more in-depth and zoom into the recent time frame...
Stay tuned if you are keen...

WTI Oil H4 | Falling to overlap supportWTI oil (USOIL) is falling towards an overlap support and could potentially bounce off this level to climb higher.
Buy entry is at 72.65 which is an overlap support that aligns close to the 23.6% Fibonacci retracement level.
Stop loss is at 71.10 which is a level that lies underneath a pullback support and the 50.0% Fibonacci retracement level.
Take profit is at 75.13 which is a pullback resistance.
High Risk Investment Warning
Trading Forex/CFDs on margin carries a high level of risk and may not be suitable for all investors. Leverage can work against you.
Stratos Markets Limited (www.fxcm.com):
CFDs are complex instruments and come with a high risk of losing money rapidly due to leverage. 64% of retail investor accounts lose money when trading CFDs with this provider. You should consider whether you understand how CFDs work and whether you can afford to take the high risk of losing your money.
Stratos Europe Ltd (www.fxcm.com):
CFDs are complex instruments and come with a high risk of losing money rapidly due to leverage. 66% of retail investor accounts lose money when trading CFDs with this provider. You should consider whether you understand how CFDs work and whether you can afford to take the high risk of losing your money.
Stratos Trading Pty. Limited (www.fxcm.com):
Trading FX/CFDs carries significant risks. FXCM AU (AFSL 309763), please read the Financial Services Guide, Product Disclosure Statement, Target Market Determination and Terms of Business at www.fxcm.com
Stratos Global LLC (www.fxcm.com):
Losses can exceed deposits.
Please be advised that the information presented on TradingView is provided to FXCM (‘Company’, ‘we’) by a third-party provider (‘TFA Global Pte Ltd’). Please be reminded that you are solely responsible for the trading decisions on your account. There is a very high degree of risk involved in trading. Any information and/or content is intended entirely for research, educational and informational purposes only and does not constitute investment or consultation advice or investment strategy. The information is not tailored to the investment needs of any specific person and therefore does not involve a consideration of any of the investment objectives, financial situation or needs of any viewer that may receive it. Kindly also note that past performance is not a reliable indicator of future results. Actual results may differ materially from those anticipated in forward-looking or past performance statements. We assume no liability as to the accuracy or completeness of any of the information and/or content provided herein and the Company cannot be held responsible for any omission, mistake nor for any loss or damage including without limitation to any loss of profit which may arise from reliance on any information supplied by TFA Global Pte Ltd.
The speaker(s) is neither an employee, agent nor representative of FXCM and is therefore acting independently. The opinions given are their own, constitute general market commentary, and do not constitute the opinion or advice of FXCM or any form of personal or investment advice. FXCM neither endorses nor guarantees offerings of third-party speakers, nor is FXCM responsible for the content, veracity or opinions of third-party speakers, presenters or participants.

Oil Bulls Go for the Break into Yearly OpenOil prices are threatening a major breakout here after clearing resistance yesterday at the objective 2024 yearly open near 72.14 .
The focus is on todays close with respect to the 61.8% retracement at 73.90 . A daily close above would keep the focus on a possible rally towrads the 78.6% retracement at 75.89 and the October high-close at 77.25 - note the highlighted slope confluence (look for a larger reaction there IF reached).
Initial support back at 72.14 with bullish invalidation now raised to 71.02 .
MB

Murphy Oil Corp START BUY at 14The company in the energy sector is undertaking efforts to optimize debts and increase efficiency in production. Stable dividends and share buybacks create an interesting investment opportunity

WTI OIL Break-out or rejection strategy.WTI Oil (USOIL) gave us an excellent buy signal last time (December 27, see chart below) that produced a Bullish Leg straight to our $72.80 Target:
The price is right now above Resistance 2 and almost at the top (Higher Highs trend-line) of the Channel Up. Having completed a +6.65% rise (which was the previous Bullish Leg), it is now highly likely to start seeing a reversal to a Bearish Leg. Especially since the 1D RSI is testing the October 07 2024 High.
As long the price gets rejected below the top of the Channel Up, we will be bearish, targeting $70.50 (above the 0.618 Fib and the 1D MA50). If the price breaks and closes a 1D candle above the Channel Up, we will take the small loss and switch to a buy, targeting the 1D MA200 (orange trend-line) at $75.15.
-------------------------------------------------------------------------------
** Please LIKE 👍, FOLLOW ✅, SHARE 🙌 and COMMENT ✍ if you enjoy this idea! Also share your ideas and charts in the comments section below! This is best way to keep it relevant, support us, keep the content here free and allow the idea to reach as many people as possible. **
-------------------------------------------------------------------------------
💸💸💸💸💸💸
👇 👇 👇 👇 👇 👇

Crude Oil January Futures: Bullish Option Trade SetupBuilding upon my prior analysis, where I held a bearish outlook on Crude Oil January Futures , I now present a contrasting bullish perspective. While I had previously emphasized the confidentiality of the stop-loss level for short trades, this setup focuses on a call option strategy aligned with my expectations of upward momentum in the market.
For this trade, I have chosen the 6000 strike call option . The optimal entry point for this position is below ₹234.20 , providing a favorable risk-reward ratio. As of this writing, the current market quote (best offer) stands at ₹186.00 , offering an attractive entry opportunity for bullish traders.
My target for this position is set at ₹468.40 , which I anticipate achieving by the contract's expiry on 15th January 2025.
Key Notes:
This trade is based on my personal analysis and market perspective.
It is important to emphasize that this is not a trade recommendation for the public.
The stop-loss level remains confidential and forms an integral part of my risk management approach.
Disclaimer:
Trading in options and futures involves significant risk and may not be suitable for all investors. This analysis is solely my personal view and is shared for informational purposes. Perform your own due diligence or consult with a financial advisor before making any trading decisions.

WTI Oil D1 | Potential bearish reversalWTI oil (USOIL) is rising towards a swing-high resistance and could potentially reverse off this level to drop lower.
Sell entry is at 72.17 which is a swing-high resistance that aligns with the 50.0% Fibonacci retracement level.
Stop loss is at 73.60 which is a level that sits above a pullback resistance.
Take profit is at 69.21 which is a swing-low support.
High Risk Investment Warning
Trading Forex/CFDs on margin carries a high level of risk and may not be suitable for all investors. Leverage can work against you.
Stratos Markets Limited (www.fxcm.com):
CFDs are complex instruments and come with a high risk of losing money rapidly due to leverage. 64% of retail investor accounts lose money when trading CFDs with this provider. You should consider whether you understand how CFDs work and whether you can afford to take the high risk of losing your money.
Stratos Europe Ltd (www.fxcm.com):
CFDs are complex instruments and come with a high risk of losing money rapidly due to leverage. 66% of retail investor accounts lose money when trading CFDs with this provider. You should consider whether you understand how CFDs work and whether you can afford to take the high risk of losing your money.
Stratos Trading Pty. Limited (www.fxcm.com):
Trading FX/CFDs carries significant risks. FXCM AU (AFSL 309763), please read the Financial Services Guide, Product Disclosure Statement, Target Market Determination and Terms of Business at www.fxcm.com
Stratos Global LLC (www.fxcm.com):
Losses can exceed deposits.
Please be advised that the information presented on TradingView is provided to FXCM (‘Company’, ‘we’) by a third-party provider (‘TFA Global Pte Ltd’). Please be reminded that you are solely responsible for the trading decisions on your account. There is a very high degree of risk involved in trading. Any information and/or content is intended entirely for research, educational and informational purposes only and does not constitute investment or consultation advice or investment strategy. The information is not tailored to the investment needs of any specific person and therefore does not involve a consideration of any of the investment objectives, financial situation or needs of any viewer that may receive it. Kindly also note that past performance is not a reliable indicator of future results. Actual results may differ materially from those anticipated in forward-looking or past performance statements. We assume no liability as to the accuracy or completeness of any of the information and/or content provided herein and the Company cannot be held responsible for any omission, mistake nor for any loss or damage including without limitation to any loss of profit which may arise from reliance on any information supplied by TFA Global Pte Ltd.
The speaker(s) is neither an employee, agent nor representative of FXCM and is therefore acting independently. The opinions given are their own, constitute general market commentary, and do not constitute the opinion or advice of FXCM or any form of personal or investment advice. FXCM neither endorses nor guarantees offerings of third-party speakers, nor is FXCM responsible for the content, veracity or opinions of third-party speakers, presenters or participants.

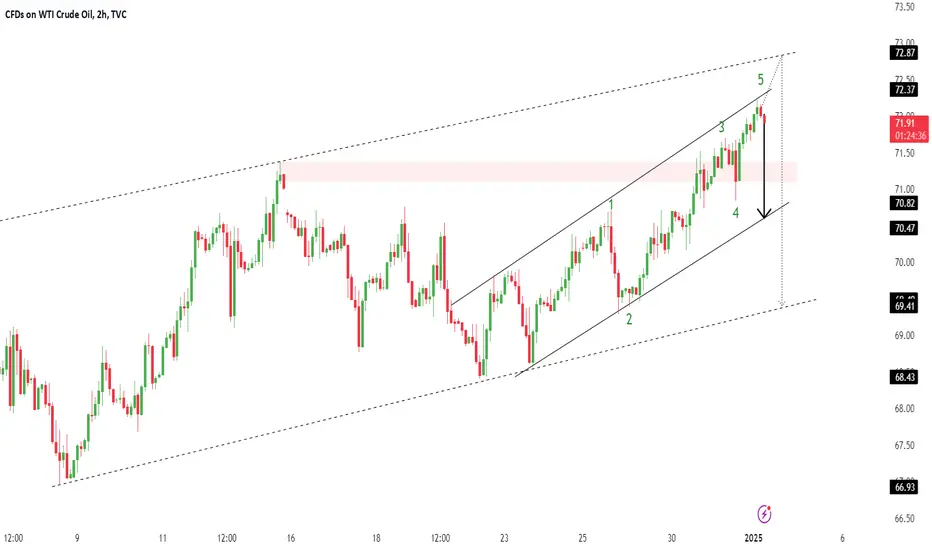
US OilUS Oil - Crude Oil
Completed " 12345 " Impulsive Waves
Break of Structure
RSI - Divergence
Bullish Channel as an Corrective Pattern in Short Time Frame
Change OF Characteristics
Crude Oil Eating Up Time - Plate almost emptyPrice bounced many times at the Green Support-Zone. It's the same level where the Huge Pendulums Fork Center-Line is (white-dashed).
Next, we have the Yellow Fork.
Price traded outside the L-MLH, bounced a couple times at the Support-Zone and eat up time.
But now, I think the "Plate" is almost empty.
Why? Price arrived at a decision point, a confluence point. This confluence point is where the Warning-Line and Price intersect.
To me, a Long Trade is more likely than a Short.
- world wide tensions
- so many bounces at the Support-Zone, they won't let price go down much
- price has not re-tested the L-MLH of the Yellow Pitchfork
As this is a very long term play, it's obvious that this Chart/Idea would serve to build a position, rather than using it as a simple trade.

Trading Plan: WTI Crude OilBased on my proprietary indicators, I maintain a bearish view on WTI Crude Oil. I am anticipating a downside target of ₹5800 (target open until 15th January 2025).
Current Position:
Holding short positions in MCX Crude Oil January 2025 expiry futures from ₹6025 levels.
Intend to add more shorts if prices move to higher levels.
Risk Management:
Stop-loss and risk parameters are carefully planned but not disclosed here for strategic reasons.
Position sizing is aligned with my overall risk appetite and trading capital.
Disclaimer:
This trading plan represents my personal views and trading decisions and is shared for informational purposes only.
Trading in crude oil futures involves significant risk and may not be suitable for all investors.
Readers should not consider this as financial advice and must conduct their own research or consult with a certified financial advisor before making any trading or investment decisions.
Past performance of proprietary indicators is not indicative of future results.

WTI OIL Will it hold the 4H MA200 and rebound?WTI Oil (USOIL) almost tested on yesterday's pull-back the 4H MA200 (orange trend-line), following Monday's rebound on the former Lower Highs trend-line. This technical shift from a Resistance level turning Support, signifies the emergence of a new Channel Up pattern, which needs to hold the 4H MA200 in order to materialize the new Bullish Leg to a new Higher High.
The pattern's first Higher High was priced on the 71.45 Resistance (1) and if the current Higher Low holds at the bottom of the Channel Up, we expect an equally powerful Bullish Leg for the next Higher High. However the 1D MA100 (red trend-line) needs to break as it currently poses the strongest Resistance, having rejected the uptrend not just on the Resistance 1 test (December 13) but also yesterday (December 26).
As a result, if this level breaks, we expect the trend to hit at least Resistance 2 with our Target being $72.80.
-------------------------------------------------------------------------------
** Please LIKE 👍, FOLLOW ✅, SHARE 🙌 and COMMENT ✍ if you enjoy this idea! Also share your ideas and charts in the comments section below! This is best way to keep it relevant, support us, keep the content here free and allow the idea to reach as many people as possible. **
-------------------------------------------------------------------------------
💸💸💸💸💸💸
👇 👇 👇 👇 👇 👇

WTI Oil H1 | Rising into multi-swing-high resistanceWTI oil (USOIL) is rising towards a multi-swing-high resistance and could potentially reverse off this level to drop lower.
Sell entry is at 70.37 which is a multi-swing-high resistance.
Stop loss is at 70.70 which is a level that sits above a swing-high resistance.
Take profit is at 69.48 which is an overlap support that aligns with the 50.0% Fibonacci retracement.
High Risk Investment Warning
Trading Forex/CFDs on margin carries a high level of risk and may not be suitable for all investors. Leverage can work against you.
Stratos Markets Limited (www.fxcm.com):
CFDs are complex instruments and come with a high risk of losing money rapidly due to leverage. 64% of retail investor accounts lose money when trading CFDs with this provider. You should consider whether you understand how CFDs work and whether you can afford to take the high risk of losing your money.
Stratos Europe Ltd (www.fxcm.com):
CFDs are complex instruments and come with a high risk of losing money rapidly due to leverage. 66% of retail investor accounts lose money when trading CFDs with this provider. You should consider whether you understand how CFDs work and whether you can afford to take the high risk of losing your money.
Stratos Trading Pty. Limited (www.fxcm.com):
Trading FX/CFDs carries significant risks. FXCM AU (AFSL 309763), please read the Financial Services Guide, Product Disclosure Statement, Target Market Determination and Terms of Business at www.fxcm.com
Stratos Global LLC (www.fxcm.com):
Losses can exceed deposits.
Please be advised that the information presented on TradingView is provided to FXCM (‘Company’, ‘we’) by a third-party provider (‘TFA Global Pte Ltd’). Please be reminded that you are solely responsible for the trading decisions on your account. There is a very high degree of risk involved in trading. Any information and/or content is intended entirely for research, educational and informational purposes only and does not constitute investment or consultation advice or investment strategy. The information is not tailored to the investment needs of any specific person and therefore does not involve a consideration of any of the investment objectives, financial situation or needs of any viewer that may receive it. Kindly also note that past performance is not a reliable indicator of future results. Actual results may differ materially from those anticipated in forward-looking or past performance statements. We assume no liability as to the accuracy or completeness of any of the information and/or content provided herein and the Company cannot be held responsible for any omission, mistake nor for any loss or damage including without limitation to any loss of profit which may arise from reliance on any information supplied by TFA Global Pte Ltd.
The speaker(s) is neither an employee, agent nor representative of FXCM and is therefore acting independently. The opinions given are their own, constitute general market commentary, and do not constitute the opinion or advice of FXCM or any form of personal or investment advice. FXCM neither endorses nor guarantees offerings of third party speakers, nor is FXCM responsible for the content, veracity or opinions of third-party speakers, presenters or participants.

WTI Oil H4 | Swing-high resistance at 50% Fibonacci retracementWTI oil (USOIL) is rising towards a swing-high resistance and could potentially reverse off this level to drop lower.
Sell entry is at 69.85 which is a swing-high resistance that aligns with a 50% Fibonacci retracement.
Stop loss is at 70.66 which is a level that sits above the 61.8% Fibonacci retracement and a swing-high resistance.
Take profit is at 68.52 which is a swing-low support.
High Risk Investment Warning
Trading Forex/CFDs on margin carries a high level of risk and may not be suitable for all investors. Leverage can work against you.
Stratos Markets Limited (www.fxcm.com):
CFDs are complex instruments and come with a high risk of losing money rapidly due to leverage. 64% of retail investor accounts lose money when trading CFDs with this provider. You should consider whether you understand how CFDs work and whether you can afford to take the high risk of losing your money.
Stratos Europe Ltd (www.fxcm.com):
CFDs are complex instruments and come with a high risk of losing money rapidly due to leverage. 66% of retail investor accounts lose money when trading CFDs with this provider. You should consider whether you understand how CFDs work and whether you can afford to take the high risk of losing your money.
Stratos Trading Pty. Limited (www.fxcm.com):
Trading FX/CFDs carries significant risks. FXCM AU (AFSL 309763), please read the Financial Services Guide, Product Disclosure Statement, Target Market Determination and Terms of Business at www.fxcm.com
Stratos Global LLC (www.fxcm.com):
Losses can exceed deposits.
Please be advised that the information presented on TradingView is provided to FXCM (‘Company’, ‘we’) by a third-party provider (‘TFA Global Pte Ltd’). Please be reminded that you are solely responsible for the trading decisions on your account. There is a very high degree of risk involved in trading. Any information and/or content is intended entirely for research, educational and informational purposes only and does not constitute investment or consultation advice or investment strategy. The information is not tailored to the investment needs of any specific person and therefore does not involve a consideration of any of the investment objectives, financial situation or needs of any viewer that may receive it. Kindly also note that past performance is not a reliable indicator of future results. Actual results may differ materially from those anticipated in forward-looking or past performance statements. We assume no liability as to the accuracy or completeness of any of the information and/or content provided herein and the Company cannot be held responsible for any omission, mistake nor for any loss or damage including without limitation to any loss of profit which may arise from reliance on any information supplied by TFA Global Pte Ltd.
The speaker(s) is neither an employee, agent nor representative of FXCM and is therefore acting independently. The opinions given are their own, constitute general market commentary, and do not constitute the opinion or advice of FXCM or any form of personal or investment advice. FXCM neither endorses nor guarantees offerings of third party speakers, nor is FXCM responsible for the content, veracity or opinions of third-party speakers, presenters or participants.
