Oil continues to ascend within the upward-sloping channelWest Texas Intermediate crude oil regained a bullish momentum and managed to establish a new high at $81.58, which marks the highest value in over four months. Additionally, RSI, MACD, and Stochastic all moved higher on the daily chart. These developments are positive for oil and bolster a bullish case in the short term and medium term. However, while it is possible that oil might reach $85 per barrel (or perhaps even $90, depending on the global economy, oil supply/demand dynamics, and the situation in the Middle East), we are skeptical about such high price tags as $100 per barrel in the coming months. In our opinion, the United States will continue to ramp up its production against OPEC, which is trying to balance the market by cutting its own production quotas. Furthermore, the declining industrial and manufacturing production in Europe and the United States is likely to continue holding a lid over rising oil prices. Consequently, at the moment, we see very limited upside for oil.
Illustration 1.01
Illustration 1.01 shows the ADX’s daily chart, which reflects the trend’s momentum. Yellow arrows indicate a temporary decline in momentum ahead of the OPEC’s monthly report and subsequent awakening after the report.
Illustration 1.02
The image above shows the daily chart of USOIL and simple support/resistance levels derived from past peaks and troughs.
Technical analysis
Daily time frame = Bullish
Weekly time frame = Bullish
Please feel free to express your ideas and thoughts in the comment section.
DISCLAIMER: This analysis is not intended to encourage any buying or selling of any particular securities. Furthermore, it should not be a basis for taking any trade action by an individual investor or any other entity. Your own due diligence is highly advised before entering a trade.
Crude Oil

USOIL Trading IdeaBased on Simple Technical Analysis ( Trendline + Support & Resistance )
Risk Disclaimer:
Please be advised that I am not telling anyone how to spend or invest their money. Take all of my analysis as my own opinion, as entertainment, and at your own risk. I assume no responsibility or liability for any errors or omissions in the content of this page, and they are for educational purposes only. Any action you take on the information in these analysis is strictly at your own risk. There is a very high degree of risk involved in trading. Past results are not indicative of future returns. Good luck :-)

Crude Oil (WTI) at ResistanceCrude oil is currently facing resistance on a 1-hour time frame.
We've established an upper and lower zone for trading.
On the weekly candle from last week, the price closed above the previous week's level, which indicates a possible uptrend towards higher levels around 83.
If there is a significant gap in the price on Sunday, we should watch for how the price reacts at these levels before closing the gap.
I'd appreciate your thoughts on this.

CRUDE OIL(WTI): Bullish Outlook For Next Week 🛢️
Crude Oil broke and closed above a key daily resistance this week.
The broken structure turned into a strong demand zone.
We can expect a growth from the underlined blue area at least to 82.5
❤️Please, support my work with like, thank you!❤️

OIL Bullish Heist Plan to make moneyAm going to heist the Crude Oil at bullish side. This is my plan to Loot the money in this method. I set my Buy Stop at Pivot line. when it trigger Golden cross my loot will start.

CRUDE OIL (WTI): Bullish Trend Continues 🛢️
Crude Oil set a new higher high higher close on a daily,
violating a key horizontal structure resistance.
It is a strong trend-following signal that indicates that growth will most likely continue.
Next goal - 82.4
❤️Please, support my work with like, thank you!❤️

Crude Oil Demand ZoneCrude oil is at all time highs as it pulls back into todays opening range.
this is also a 15 minute demand zone.
Entry at previous weeks high
Stop loss is right below structure on the 15 min and 1 hour chart.

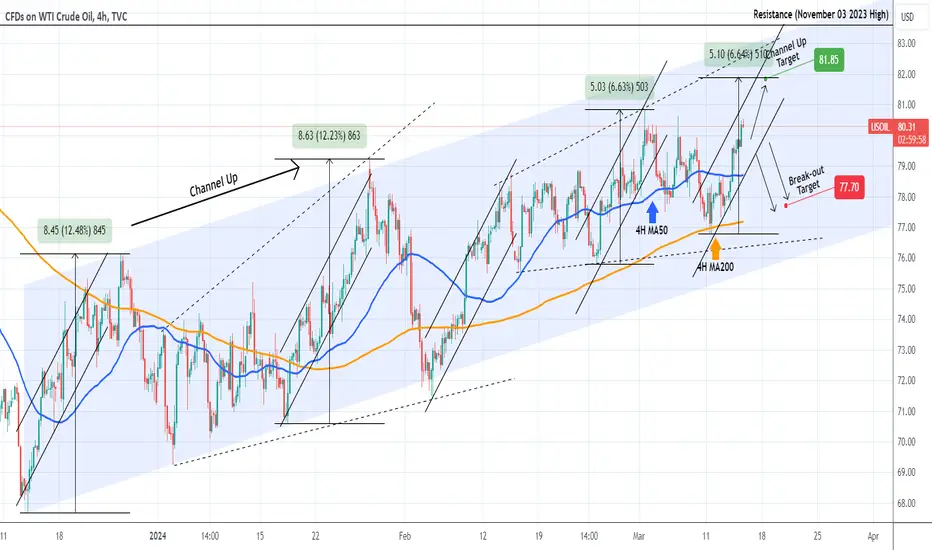
WTI OIL Trade according to this Channel Up.WTI Oil (USOIL) is trading within a short-term Channel Up on the 4H time-frame, with the wider pattern still a Channel Up since the December 13 2023 market bottom. As long as the price keeps closing the 4H candles within the Channel Up, we remain bullish, targeting 81.85 (+6.64%, which is the rise of the previous Bullish Leg of the dashed Rising Megaphone).
If a 4H candle is closed below it, we will take the loss and open a sell aimed at the 4H MA200 (orange trend-line) at 77.70.
-------------------------------------------------------------------------------
** Please LIKE 👍, FOLLOW ✅, SHARE 🙌 and COMMENT ✍ if you enjoy this idea! Also share your ideas and charts in the comments section below! This is best way to keep it relevant, support us, keep the content here free and allow the idea to reach as many people as possible. **
-------------------------------------------------------------------------------
💸💸💸💸💸💸
👇 👇 👇 👇 👇 👇
WTI CRUDE OIL Potential rejection on a Falling Resistance.WTI Crude Oil is close to making a 3rd contact on the Falling Resistance, which last time ended in a 4hour MA200 test.
Along with the Rising Support, this pattern resembles December-January, which later broke upwards to a new High.
Until it does, sell and target the 1day MA200 again at 77.50.
Follow us, like the idea and leave a comment below!!

Crude OilPair : Crude Oil
Description :
Bullish Channel as an Corrective Pattern in Long Time Frame
Completed " 123 " Impulsive Waves
Break of Structure
RSI - Divergence
Bearish Channel as an Correction Short Time Frame

CRUDE OIL (WTI): Detailed Technical Analysis 🛢
Price action analysis on WTI Crude Oil.
Key levels.
Potential scenarios.
Trading plan.
❤️Please, support this video with like and comment!❤️

♥ DayTraderBaby Crude Oil Longs 📈9:45 am entry
higher low created 77.58
Nice bullish candle engulfment & Break of structure
TP 78.57(1.618 extension ) 84 Pips ✔

Bullish trend is still relatively weakWest Texas Intermediate crude oil continues to trade within the upward-sloping channel. However, its bullish trend remains weak, as reflected in the relatively low (but growing) value of ADX (on the daily time frame). In the past two trading sessions, the daily RSI continued to flatten, Stochastic turned lower, and MACD performed a bearish crossover while staying above the midpoint. With these developments unfolding, we pay close attention to the 20-day SMA and resistance levels at $79.25 and $79.72. The price’s ability to retest these resistance levels and ideally maintain a ground above them will bolster a bullish case in the short term. In contrast, a breakdown below the 20-day SMA might hint at oil wanting to slide toward the channel's lower bound.
Illustration 1.01
Illustration 1.01 shows the daily graph of USOIL and two simple moving averages. The yellow arrow indicates the oil’s recent retracement toward its 20-day SMA, which acts as a support.
Illustration 1.02
Illustration 1.02 shows the daily MACD. The yellow arrow highlights a bearish crossover between the MACD and signal lines. While this is slightly bearish, it is important to note that MACD remains in the bullish territory.
Illustration 1.03
The chart above illustrates simple support/resistance levels derived from past peaks and troughs; one more alternative resistance lies at $79.72.
Technical analysis
Daily time frame = Bullish (weak)
Weekly time frame = Neutral
Please feel free to express your ideas and thoughts in the comment section.
DISCLAIMER: This analysis is not intended to encourage any buying or selling of any particular securities. Furthermore, it should not be a basis for taking any trade action by an individual investor or any other entity. Your own due diligence is highly advised before entering a trade.

WTI Oil Price Declines Amidst China Import DataDuring Monday's trading session, the WTI oil price commenced a decline, hovering around $77.35, following a bullish candle that countered three consecutive negative days. Market analysts suggest that the price may experience a pullback at the resistance and supply area indicated on the chart (highlighted in the red rectangle). This anticipated pullback is primarily driven by recent data indicating a notable decrease in oil imports in China.
According to reports, oil imports in China plummeted by approximately 5.7% to 10.8 million barrels per day (bpd) in the first two months of the year, compared to 11.44 million bpd recorded in December. This decline in oil imports has exerted downward pressure on the WTI oil price, which is currently trading around $77.00 per barrel during the Asian trading hours on Monday.
Given the prevailing market conditions, market participants are closely monitoring the potential for a pullback in the oil price, with a targeted level around $78, followed by a potential downward push towards the $76 area or lower.
Amidst these developments, the market is adopting a cautious stance ahead of the release of crucial economic data from the United States (US). Specifically, investors are eagerly awaiting the release of the Consumer Price Index (CPI) data scheduled for Tuesday. Additionally, Retail Sales and Producer Price Index (PPI) data, expected on Thursday, are anticipated to provide further insights into the US economic landscape. These data releases carry significant weight amidst growing expectations of a Federal Reserve (Fed) interest rate cut in June.
As the week progresses, market participants will continue to monitor these key economic indicators to gauge the overall health of the US economy and its potential implications for future monetary policy decisions by the Fed.

CL OIL H4 11 March 2024 🛢 CL OIL, H4 🛢 11 March 2024
Crude oil prices experience a slight dip as apprehensions persist over soft Chinese demand. Despite OPEC+ extending supply cuts, China's conservative economic growth target of around 5% for 2024 raises concerns. Analysts emphasise the challenging outlook without additional stimulus measures. Attention shifts to major central banks' potential rate cuts, including the Federal Reserve and the ECB, as lower rates could stimulate oil demand by fostering economic growth.
Oil prices are trading lower following the prior breakout below the previous support level. Suggesting the commodity might extend its losses.
Resistance level: 78.00, 80.20📉
Support level: 75.95, 73.45📈

USOIL Trading IdeaBased on Simple Technical Analysis ( Trendline + Support & Resistance )
Risk Disclaimer:
Please be advised that I am not telling anyone how to spend or invest their money. Take all of my analysis as my own opinion, as entertainment, and at your own risk. I assume no responsibility or liability for any errors or omissions in the content of this page, and they are for educational purposes only. Any action you take on the information in these analysis is strictly at your own risk. There is a very high degree of risk involved in trading. Past results are not indicative of future returns. Good luck :-)

CRUDE OIL Broke The Rising Support! Sell!
Hello,Traders!
CRUDE OIL was trading along
The rising support but now we
Are seeing a bearish breakout
And the breakout is confirmed
So we will be expecting a
Further move down
Sell!
Like, comment and subscribe to help us grow!
Check out other forecasts below too!

✅CRUDE OIL BEARISH BREAKOUT|SHORT🔥
✅CRUDE OIL broke the rising
Support so we are bearish
Biased and I think that
We will see a further move down
SHORT🔥
✅Like and subscribe to never miss a new idea!✅

CRUDE OIL (WTI): Bullish Trend Continues 🛢️
Crude Oil is trading in a bullish trend.
The price retraced to a solid vertical trend line on a daily.
After its test, I spotted a confirmed bullish breakout of a resistance line
of a falling channel on an hourly time frame.
I think that bullish rally may resume soon.
Goals: 78.0 / 80.6
❤️Please, support my work with like, thank you!❤️

CL Crude Oil WTI LONGMy bias all week has been for oil to trade to the PWH. So far, I've been given no trigger to get involved.
However, end of NY session saw H4 candle bullish closing disrespecting bearish arrays.
I want to see these levels respected as bullish arrays to then look for m15 bullish displacement long entry.

CL WTI Crude Oil ShortMy weekly bias is for price to trade up to previous weeks highs, but Mondays price action has me leaning towards a pullback before we trade up mid/late week.
Today's candle was quite bearish, so I am looking for price to trade down to Monday's lows, and possibly trade into the untapped lows from several daily candles formed last week.
I want to see price trade into and respect a bearish premium array to trigger me to look for short entry on m5/m15.

USOIL getting positioned for more gains? Yesterday, OPEC and its allies announced plans to extend a voluntary oil production cut of 2.2 million barrels per day through June 2024. Currently, the USOIL trades near $80.20 per barrel, and its structure is undergoing a significant change. Since late November 2023, the USOIL has traded predominantly sideways between $70 and $80 per barrel. However, last week, it broke above the resistance at $79.25 and established a new high in more than three months. By doing so, the USOIL formed an ascending channel, which is a bullish structure. In addition to that, the ADX started to tick slightly higher on the daily chart, suggesting the trend might be gaining bullish momentum. On top of that, technical indicators (on the daily chart), including RSI, MACD, and Stochastic, all turned to the upside, which is yet another bullish sign. Finally, it looks like the USOIL might be awakening and getting positioned for more gains in the short-term and medium-term future.
Illustration 1.01
While OPEC and its allies are cutting oil production, the United States is doing the opposite; in fact, the U.S. crude oil production rose approximately 10% in 2023.
Technical analysis
Daily time frame = Bullish (weak trend)
Weekly time frame = Neutral
Please feel free to express your ideas and thoughts in the comment section.
DISCLAIMER: This analysis is not intended to encourage any buying or selling of any particular securities. Furthermore, it should not be a basis for taking any trade action by an individual investor or any other entity. Your own due diligence is highly advised before entering a trade.

Crude OilPair : Crude Oil
Description :
Completed " 12345 " Impulsive Waves and " A " Corrective Waves
Break of Structure and Retracement
Fibonacci Level - 50.00% / 61.80%
RSI - Divergence
Bullish Channel as an Corrective Pattern in Short Time Frame
