WTI Crude Oil Regains Bullish MomentumWTI Crude Oil Regains Bullish Momentum
WTI Crude oil prices climbed higher above $70.00 and might extend gains.
Important Takeaways for WTI Crude Oil Price Analysis Today
- WTI Crude oil prices started a decent increase above the $65.00 and $68.50 resistance levels.
- There is a major bullish trend line forming with support at $71.50 on the hourly chart of XTI/USD at FXOpen.
Oil Price Technical Analysis
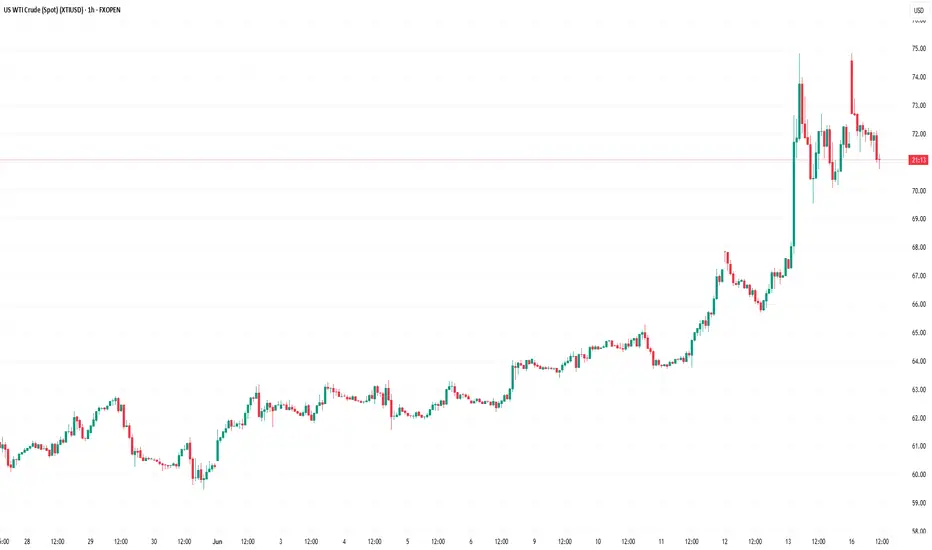
On the hourly chart of WTI Crude Oil at FXOpen, the price started a decent upward move from $65.00 against the US Dollar. The price gained bullish momentum after it broke the $68.50 resistance and the 50-hour simple moving average.
The bulls pushed the price above the $69.50 and $71.50 resistance levels. The recent high was formed at $74.80 and the price started a downside correction. There was a minor move below the 50% Fib retracement level of the upward move from the $69.55 swing low to the $74.83 high.
The RSI is now below the 60 level. Immediate support on the downside is near the $71.50 zone. There is also a major bullish trend line forming with support at $71.50 and the 61.8% Fib retracement level of the upward move from the $69.55 swing low to the $74.83 high.
The next major support on the WTI crude oil chart is near the $69.50 zone, below which the price could test the $67.90 level. If there is a downside break, the price might decline toward $65.20. Any more losses may perhaps open the doors for a move toward the $63.75 support zone.
If the price climbs higher again, it could face resistance near $72.50. The next major resistance is near the $74.80 level. Any more gains might send the price toward the $78.50 level.
This article represents the opinion of the Companies operating under the FXOpen brand only. It is not to be construed as an offer, solicitation, or recommendation with respect to products and services provided by the Companies operating under the FXOpen brand, nor is it to be considered financial advice.
Crude Oil
CL ready for new move upBased on time fib and Feigenbaum constants, CL is closing in on the bottom for this swing, expected within marked timezone. The swing highs/lows follows the Feigenbaum projections for the last few swings. I expect a dip below $57 before a new run higher, at least to $72-73.

Oil Price Rally Stalls at $77.72, Just Below 2025 HighFenzoFx—Oil prices resumed their bullish trend, accelerating after geopolitical tensions in the Middle East. The rally paused at $77.72, just below the 2025 high.
RSI 14 indicates an overbought market, while volume accumulation at $73.7 suggests possible sell orders. A consolidation phase is likely before further gains.
If oil pulls back, key demand zones at $64.00 and $66.00 offer bullish opportunities, with a potential move toward the 2025 high at $80.59.

USOIL || Geopolitical Spike Hits Major Resistance - Watch $77.77🛢️
📅 June 13, 2025
👤 By: MJTRADING
🔍 🧭 Fundamental Context – Risk Premium on the Rise:
Crude oil surged sharply today following reports of Israeli airstrikes on Iranian territory — a move that reawakens fears of broader Middle East escalation. Iran plays a crucial role in OPEC and controls the strategic Strait of Hormuz , through which ~20% of global oil passes.
While Iran has not officially responded yet, markets are pricing in the potential for:
* Military retaliation
* Disruption of oil exports or maritime routes
* Heightened volatility across global risk assets
=======================================================
📉 📊 Technical Structure – Tag of Key Resistance at $77.7:
Price exploded upward, piercing the descending channel that's been intact since mid-2022.
Today's daily wick tagged the $77.70 level, a major horizontal resistance and channel top.
This zone has repeatedly acted as a pivot in both bullish and bearish phases.
Volume confirmed the move – highest daily volume in months, suggesting institutional reaction.
💡 Trading Outlook:
🔼 Scenario A – Breakout & Close Above $77.7 = Bull Continuation
If tomorrow closes firmly above $77.70:
Target 1: $88.88 supply zone
Target 2: $90.00 psychological resistance
Setup: Conservative entries on retest of $75–77 area with tight invalidation
🔽 Scenario B – Failed Breakout → Fade Back Inside Channel
If this was a headline-driven spike with no follow-through, bears may re-enter strongly
A close below $75 could confirm bull trap
Support zone to watch: $66.66 (mid-channel, EMA confluence)
⚠️ Risk Factors to Monitor:
Iran’s response (military, diplomatic, strategic)
US/NATO reaction to potential escalation
Strait of Hormuz disruption
OPEC commentary or Saudi-led output adjustment
Market sentiment unwind (profit-taking from overbought spike)
💬 Markets love emotion, but traders survive with structure. This is not the time to be reckless — size down, be responsive, and respect both breakouts and fakeouts.
📎 #CrudeOil #Geopolitics #OilSpike #WTI #MiddleEastTensions #Iran #IranIsrael #TechnicalAnalysis #MJTRADING

California Resources Corporation (CRC) – Stock Analysis and ForeCalifornia Resources Corporation, a key player in crude oil production and carbon management, has recently experienced a notable uptick in investor interest.
This momentum appears to be supported by macroeconomic tailwinds, including renewed trade tensions between the United States and other major economies.
Historically, geopolitical uncertainty often leads to increased energy demand and price volatility, both of which tend to benefit domestic oil producers like CRC.
From a fundamental standpoint, investor sentiment toward CRC has grown increasingly positive. The company’s strategic positioning in California's energy transition—particularly its focus on carbon capture and storage (CCS)—is beginning to resonate more with institutional investors looking to align portfolios with sustainable yet profitable energy operations.
If these supportive fundamentals continue, there is potential for the stock to reach $56 in the coming months, assuming no major changes to current market dynamics or geopolitical influences.
Technical Outlook:
Entry Point: $44.68
Stop Loss: $42.73
Take Profit 1: $50.84
Take Profit 2: $55.88
As always, trade with care, apply proper risk management, and ensure your positions align with your overall investment strategy.
If you find this helpful, kindly follow me, subscribe, like, comment and share.

Crude Oil - Two Scenarios and about Brain PowerPrice retests the L-MLH.
VI. - Price breaks upward, target is the centerline
VII. - Price reverses again, then the target is the 1/4 line, with a subsequent extended target at the red centerline, and possibly even lower at the white dashed warning line.
On a personal note:
I was once again told that the price didn’t do what I had projected.
...yeah, really, that’s how it is §8-)
After over 30 years in the markets and hundreds of coaching sessions, I’m still amazed that people think you can predict price movements as if with a magic crystal ball.
The fact that this belief still persists (even though they don’t understand even the absolute basics of trading) deeply concerns me at the core of my trading soul.
Because this growing irrationality clearly indicates that far too little is being done in terms of education – or humanity might simply go extinct in the next 100 years due to rapidly declining intelligence!
...maybe I should just create a chart and apply a few median lines/forks?
Happy trading to all of you and I pray for those with lesser brain power.

CL - Crude Oil - long strategyCL - Crude Oil - long strategy
RSI confirmed potential new long opportunities
H&S reversal pattern
There are conditions for inversion

Israel Strikes Iran. Oil and Gold Prices SurgeIsrael Strikes Iran. Oil and Gold Prices Surge
According to media reports, Israel launched a large-scale overnight strike on Iranian territory, targeting dozens of military and strategic facilities linked to the country’s nuclear programme and missile capabilities. Israeli officials justified the action by citing an existential threat from Tehran, which, according to their intelligence, is accelerating its development of nuclear weapons and expanding its arsenal of ballistic missiles.
In response, Iran has vowed severe retaliation, stating that the United States and Israel will “pay a heavy price” for the attack. US President Donald Trump has urgently convened a meeting to assess the situation.
Commodities Market Reaction
In the wake of these developments, gold — the primary safe-haven asset — surged sharply. The XAU/USD price broke above its May high, rising past $3,440. However, the all-time high near $3,498 remains intact for now.
Oil prices also spiked due to fears of supply disruption. The military conflict threatens shipping through the Strait of Hormuz, a crucial chokepoint through which one-fifth of the world’s oil supply passes. Traders quickly priced in the risk of war, anticipating a supply shortage driven by large-scale instability in the Middle East.
Technical Analysis of the XBR/USD Chart
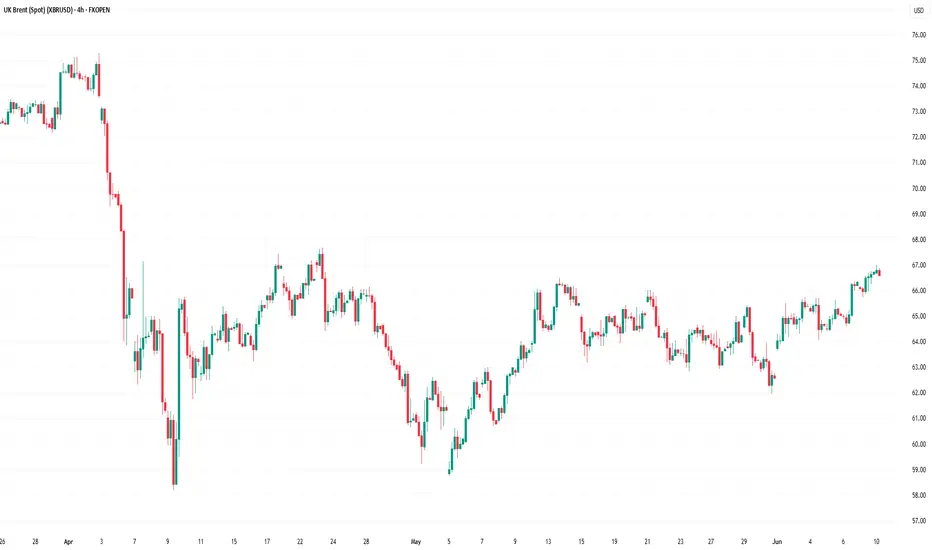
Brent crude oil price has risen to the upper boundary of a large-scale descending channel (shown in red), which is defined by lower highs from 2024–2025. As anticipated, this upper boundary acted as resistance, with the price forming a peak above $76 before reversing downward (as illustrated by the black arrow).
From a technical standpoint, following such a sharp rally, Brent is vulnerable to a corrective move. In this scenario, a pullback into the orange zone is possible, where support may be found at:
→ The psychologically important $70 level;
→ The 50% Fibonacci retracement level;
→ The former resistance of the purple descending trendline, now turned support.
Nevertheless, given the scale of the geopolitical threat, it is unlikely that market sentiment will allow Brent to decline significantly in the near term.
This article represents the opinion of the Companies operating under the FXOpen brand only. It is not to be construed as an offer, solicitation, or recommendation with respect to products and services provided by the Companies operating under the FXOpen brand, nor is it to be considered financial advice.

Chasing Oil Spikes? How Geopolitics Can Wreck SetupsOil prices surged over 12% in Asia on Middle East headlines, sparking a surge of volatility across safe-haven currencies and stock market futures during thin trade.
It felt like a good time to provide food for thought to newer traders looking to chase these moves, highlight the mockery geopolitics can make of technical analysis with recent examples, and provide a filter for when the waters may be safer to reenter.
Matt Simpson, Market Analyst at City Index and Forex.com

CRUDE OIL (WTI): Pullback From Key Level
WTI Crude Oil looks overbought after a test of key daily horizontal resistance level.
A violation of a minor horizontal support on an hourly time frame after its test
provides a strong intraday confirmation.
I expect a retracement to 66.33 level.
❤️Please, support my work with like, thank you!❤️

CRUDE OIL (WTI): Detailed Support & Resistance Analysis
Here is my latest structure analysis for WTI Oil.
Resistance 1: 63.6 - 65.9 area
Resistance 2: 68.2 - 69.2 area
Resistance 3: 71.4 - 75.2 area
Support 1: 61.8 - 62.8 area
Support 2: 59.0 - 60.8 area
Support 3: 55.1 - 57.2 area
Consider these structures for pullback/breakout trading.
❤️Please, support my work with like, thank you!❤️

XBR/USD Chart Analysis: Brent Crude Reaches 1.5-Month HighXBR/USD Chart Analysis: Brent Crude Reaches 1.5-Month High
In our analysis of Brent crude oil six days ago, we identified a large contracting triangle and a local ascending channel. We also outlined a potential scenario involving a bullish breakout above the upper boundary of the triangle.
Although this was not the base-case scenario, the XBR/USD chart now suggests it has played out: yesterday, the price climbed to nearly $67 per barrel — its highest level since the end of April.
The main bullish catalyst appears to be ongoing trade talks between the United States and China, which have raised hopes of a resolution to tariff-related tensions between the world’s two largest economies.
At the same time, rising oil prices may exacerbate geopolitical tensions, particularly amid Israeli threats to strike ports in Yemen — a risk that could disrupt supply chains across the Middle East.
Technical Analysis of the XBR/USD Chart
From a technical perspective:
→ Brent crude continues to move within an ascending channel (marked in blue);
→ the upper boundary may now act as a support level.
The fact that the price is holding in the upper half of the channel indicates strong demand-side pressure. Based on this, it is reasonable to assume that as long as Brent remains above the $65.75 level (the retest zone of the breakout), the technical outlook will remain predominantly bullish.
This article represents the opinion of the Companies operating under the FXOpen brand only. It is not to be construed as an offer, solicitation, or recommendation with respect to products and services provided by the Companies operating under the FXOpen brand, nor is it to be considered financial advice.
Crude Oil Tests Monthly High—Bullish or Liquidity Grab? FenzoFx—Crude Oil broke above its previous monthly high at $64.61, trading around $65.27. While a bullish trend is indicated by a 23,000 increase in buy-side contracts, technical signals suggest caution.
RSI 14 shows bearish divergence, and the Stochastic Oscillator remains overbought. Oil could consolidate before resuming its uptrend. Buying breakouts isn’t advised. A dip toward $63.02 may offer a discounted entry.

Weekly Market Forecast: BUY Stock Indices & Oil! Sell Gold! In this Weekly Market Forecast, we will analyze the S&P 500, NASDAQ, DOW JONES, Gold and Silver futures, for the week of June 9 - 13th.
Stock Indices are looking more bullish. Valid buys only!
Gold is weak. Sells only until there is a market structure shift upwards.
Oil prices have room to go higher. Buy it.
Silver is a wait and see. Should start to pull back this week, as it closed last week stronger than Gold.
CPI Wednesday. After the news is announced, the market should be very tradeable for the rest of the week.
Enjoy!
May profits be upon you.
Leave any questions or comments in the comment section.
I appreciate any feedback from my viewers!
Like and/or subscribe if you want more accurate analysis.
Thank you so much!
Disclaimer:
I do not provide personal investment advice and I am not a qualified licensed investment advisor.
All information found here, including any ideas, opinions, views, predictions, forecasts, commentaries, suggestions, expressed or implied herein, are for informational, entertainment or educational purposes only and should not be construed as personal investment advice. While the information provided is believed to be accurate, it may include errors or inaccuracies.
I will not and cannot be held liable for any actions you take as a result of anything you read here.
Conduct your own due diligence, or consult a licensed financial advisor or broker before making any and all investment decisions. Any investments, trades, speculations, or decisions made on the basis of any information found on this channel, expressed or implied herein, are committed at your own risk, financial or otherwise.

Short Crude Oil for The LeapRisk free trade for $100 on MCL
Scaling out of the trade from 4 hour supply to 4 hour demand.
Using the TrendCloud Trading System and it's working great.
So far I'm in the top 7% for this competition.
Focusing on managing this crude oil trade and also the opening range on the MNQ and NQ
Huge win on day 1 for $4000 on NQ opening range using the TrendCloud Trading Strategy.
Backtesting data shows great results. Super proud of this. It took me a month to program everything properly and optimize specifically for the NQ.

XBR/USD Chart Analysis: Oil Price Rises to Key ResistanceXBR/USD Chart Analysis: Oil Price Rises to Key Resistance
Yesterday, the price of Brent crude climbed above $65.60 — the highest level in over a week.
According to media reports, several bullish factors are driving this move:
→ Stalled negotiations between the US and Iran over abandoning Iran’s nuclear programme in exchange for lifting oil export sanctions;
→ Wildfires in Canada, which have significantly reduced oil output;
→ Market reaction to the OPEC+ meeting held over the weekend;
→ A weakening US dollar.
Technical Analysis of the XBR/USD Chart
From a technical standpoint, Brent crude oil:
→ Has been forming a short-term ascending channel (marked in blue) since the beginning of the week;
→ Has approached a major resistance level.
This resistance is defined by the upper boundary of a narrowing triangle, with its central axis around the $63.70 level — a price that could be considered a fair value based on trading over the past one and a half months.
This situation points to two possible scenarios:
→ A downward reversal from the key resistance, with expectations that the price will return to the triangle’s central axis. A break below the lower boundary of the local blue channel would support this scenario.
→ An attempt at a bullish breakout of the triangle. While this scenario cannot be ruled out, it appears less likely due to the global economic slowdown risks posed by tariff-related trade barriers.
This article represents the opinion of the Companies operating under the FXOpen brand only. It is not to be construed as an offer, solicitation, or recommendation with respect to products and services provided by the Companies operating under the FXOpen brand, nor is it to be considered financial advice.

Liquidity Hunt: Crude Oil's Next TargetFenzoFx—Crude Oil remains below the $64.19 resistance level. The Stochastic Oscillator is in overbought territory, and RSI 14 signals bearish divergence, suggesting a possible price dip.
Oil could briefly surpass $64.19 to grab liquidity before facing selling pressure. In this case, a drop toward the $61.72 support level may occur to fill the bullish fair value gap.
However, if Oil stabilizes above $64.19, the bearish outlook becomes invalid.
>>> Trade Crude Oil without swap and low spread at FenzoFx

WTI Crude Returns to $63Over the past two trading sessions, WTI crude oil has gained more than 5%, as confidence has temporarily returned to the market following the latest OPEC+ announcements. The organization recently announced a new production increase of 411,000 barrels per day starting in July, but the volume was lower than anticipated, which has been interpreted as a positive signal for short-term price behavior. This has helped sustain a consistent bullish bias in recent sessions.
Bearish Trend Remains Intact
Since early January, crude oil has followed a steady bearish trend. Currently, the price is approaching the resistance marked by the trendline, and if buying pressure holds in the short term, the bearish formation could come under threat in the upcoming trading sessions.
MACD
At the moment, the MACD histogram shows slight oscillations above the neutral line (0), but it has not yet indicated a decisive market impulse. As a result, a strong sense of short-term neutrality persists, as the price approaches key resistance levels.
RSI
The Relative Strength Index (RSI) is showing a similar pattern: the line is starting to rise, but it is flattening out, which could be weakening the current buying momentum and signaling a possible sideways movement in the short term.
Key Levels to Watch:
$63 – Current Barrier: Aligns with the bearish trendline and could be where price indecision intensifies, leading to continued consolidation.
$57 – Major Support: A recent low. If the price returns to this level, it could reactivate the bearish trend and lead to a deeper sell-off.
$68 – Key Resistance: Located around the 200-period moving average. A breakout above this level could mark the beginning of a new long-term bullish trend.
Written by Julian Pineda, CFA – Market Analyst

CRUDE OIL TO HIT $160?!Oil prices broke down lower in the past few weeks, after a much needed LQ grab, following a 2 year consolidation. We’ve seen a ‘5 Wave Complex Correction’, which should now be followed by price recovery.
Wait for buyers to BREAK ABOVE our ‘buying confirmation’ level, followed a by a retest before buying, otherwise leave it❗️

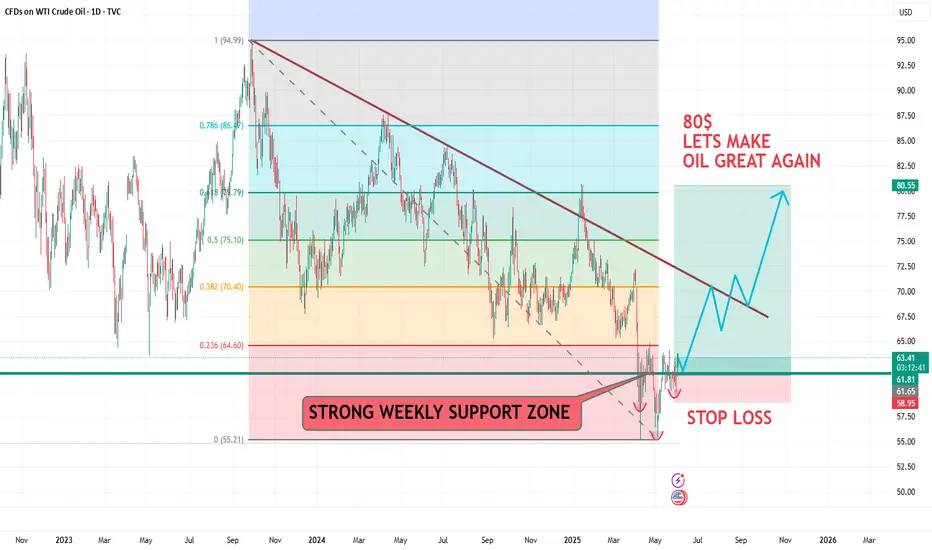
USOIL LETS MAKE OIL GREAT AGAIN TO 80$HELLO TRADERS
As i can see USOIL it formaing H & S pattrent and now trading above a strong Weekly horizontal Support zone if prices hold above 65$ then given Tp can be easy target if we see a higher demand and tight supply with the War going on around the world its a huge possibilty that pricce can shoot up we have to monitor the 65$ price zone which is importat to hold bull cycle on smaller TF 4HR it is creating Wickoff pattren too and we can see Fibo levels golden ratio can hit our targers or risk reward is great for us becaus we was buying the dip in May it is just starting chart is crystal clear its just a trade idea share your thoughts we appriciate ur comments and support Stay tuned for more updates
CRUDE OIL Swing Short! Sell!
Hello,Traders!
USOIL keeps growing
And Oil is locally overbought
So after the price hit a very
Strong resistance level
Around 65.00$ we will be
Expecting a pullback and
A local bearish correction
Sell!
Comment and subscribe to help us grow!
Check out other forecasts below too!
Disclosure: I am part of Trade Nation's Influencer program and receive a monthly fee for using their TradingView charts in my analysis.

Market Analysis: WTI Crude Oil Price Could Gain Bullish PaceMarket Analysis: WTI Crude Oil Price Could Gain Bullish Pace
WTI Crude Oil is gaining bullish momentum and might even test $62.75.
Important Takeaways for WTI Crude Oil Price Analysis Today
- WTI Crude Oil climbed above the $60.50 and $60.80 resistance levels.
- There was a break above a key bearish trend line with resistance at $60.80 on the hourly chart of XTI/USD at FXOpen.
WTI Crude Oil Price Technical Analysis
On the hourly chart of WTI Crude Oil at FXOpen, the price started a fresh upward move from $59.45 against the US Dollar. The price gained bullish momentum after it broke the $60.00 resistance.
The bulls pushed the price above the 50% Fib retracement level of the downward move from the $62.76 swing high to the $59.45 low. The price even climbed above the 50-hour simple moving average. Besides, there was a break above a key bearish trend line with resistance at $60.80.
It tested the $61.50 resistance zone and the 61.8% Fib retracement level of the downward move from the $62.76 swing high to the $59.45 low.
The RSI is now near the 50 level and the price could aim for more gains. If the price climbs higher again, it could face resistance near $62.00. The next major resistance is near the $62.75 level. Any more gains might send the price toward the $63.45 level or even $65.00.
Conversely, the price might correct gains and test the $60.80 support level. The next major support on the WTI Crude Oil chart is near the $59.45 zone, below which the price could test the $58.00 zone.
If there is a downside break, the price might decline toward $56.50. Any more losses may perhaps open the doors for a move toward the $55.50 support zone.
This article represents the opinion of the Companies operating under the FXOpen brand only. It is not to be construed as an offer, solicitation, or recommendation with respect to products and services provided by the Companies operating under the FXOpen brand, nor is it to be considered financial advice.

WTI Crude Oil – Bearish Elliott Wave SetupOn the 15-minute chart, I’m tracking a corrective rally in wave (ii) heading toward the 0.618 Fib zone (around 62.2–62.3) before the next major leg lower.
🔻 Bearish target: 52.00
📈 Looking for the final push up before confirming downside continuation.
💬 What are your thoughts on this Elliott Wave count?
For more updates and ideas, check my profile bio!
#WTI #CrudeOil #elliottwave #priceaction #technicalanalysis
