Market Analysis: Oil Slides — Traders Eye Macro TriggersMarket Analysis: Oil Slides — Traders Eye Macro Triggers
WTI Crude oil is down over 15% and remains at risk of more losses.
Important Takeaways for WTI Crude Oil Price Analysis Today
- WTI Crude oil extended losses below the $68.00 support zone.
- A major bearish trend line is forming with resistance near $65.60 on the hourly chart of XTI/USD at FXOpen.
Technical Analysis of WTI Crude Oil Price
On the hourly chart of WTI Crude Oil at FXOpen, the price struggled to continue higher above $77.00 against the US Dollar. The price formed a short-term top and started a fresh decline below $72.00.
There was a steady decline below the $70.00 pivot level. The bears even pushed the price below $68.00 and the 50-hour simple moving average. Finally, the price tested the $63.70 zone. The recent swing low was formed near $63.69, and the price is now consolidating losses.
On the upside, immediate resistance is near the $65.60 zone. There is also a major bearish trend line forming with resistance near $65.60. The next resistance is near the $66.80 level or the 23.6% Fib retracement level of the downward move from the $76.93 swing high to the $63.69 low.
The main resistance is $70.30 and the 50% Fib retracement level. A clear move above the $70.30 zone could send the price toward $71.90.
The next key resistance is near $76.90. If the price climbs further higher, it could face resistance near $78.00. Any more gains might send the price toward the $80.00 level.
Immediate support is near the $63.70 level. The next major support on the WTI Crude Oil chart is near $62.00. If there is a downside break, the price might decline toward $60.00. Any more losses may perhaps open the doors for a move toward the $55.00 support zone.
This article represents the opinion of the Companies operating under the FXOpen brand only. It is not to be construed as an offer, solicitation, or recommendation with respect to products and services provided by the Companies operating under the FXOpen brand, nor is it to be considered financial advice.
Crudeoil_analysis

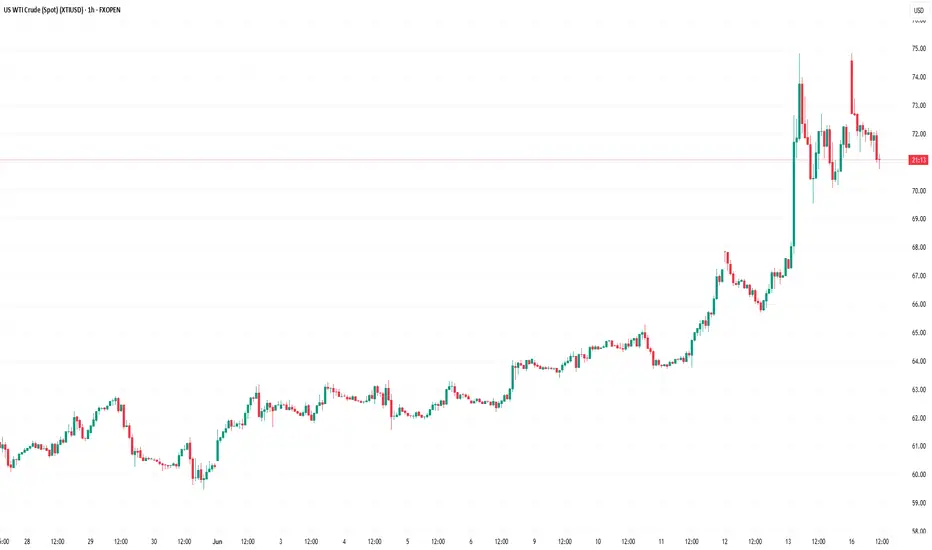
WTI Crude Oil Regains Bullish MomentumWTI Crude Oil Regains Bullish Momentum
WTI Crude oil prices climbed higher above $70.00 and might extend gains.
Important Takeaways for WTI Crude Oil Price Analysis Today
- WTI Crude oil prices started a decent increase above the $65.00 and $68.50 resistance levels.
- There is a major bullish trend line forming with support at $71.50 on the hourly chart of XTI/USD at FXOpen.
Oil Price Technical Analysis
On the hourly chart of WTI Crude Oil at FXOpen, the price started a decent upward move from $65.00 against the US Dollar. The price gained bullish momentum after it broke the $68.50 resistance and the 50-hour simple moving average.
The bulls pushed the price above the $69.50 and $71.50 resistance levels. The recent high was formed at $74.80 and the price started a downside correction. There was a minor move below the 50% Fib retracement level of the upward move from the $69.55 swing low to the $74.83 high.
The RSI is now below the 60 level. Immediate support on the downside is near the $71.50 zone. There is also a major bullish trend line forming with support at $71.50 and the 61.8% Fib retracement level of the upward move from the $69.55 swing low to the $74.83 high.
The next major support on the WTI crude oil chart is near the $69.50 zone, below which the price could test the $67.90 level. If there is a downside break, the price might decline toward $65.20. Any more losses may perhaps open the doors for a move toward the $63.75 support zone.
If the price climbs higher again, it could face resistance near $72.50. The next major resistance is near the $74.80 level. Any more gains might send the price toward the $78.50 level.
This article represents the opinion of the Companies operating under the FXOpen brand only. It is not to be construed as an offer, solicitation, or recommendation with respect to products and services provided by the Companies operating under the FXOpen brand, nor is it to be considered financial advice.
Market Analysis: WTI Crude Oil Price Could Gain Bullish PaceMarket Analysis: WTI Crude Oil Price Could Gain Bullish Pace
WTI Crude Oil is gaining bullish momentum and might even test $62.75.
Important Takeaways for WTI Crude Oil Price Analysis Today
- WTI Crude Oil climbed above the $60.50 and $60.80 resistance levels.
- There was a break above a key bearish trend line with resistance at $60.80 on the hourly chart of XTI/USD at FXOpen.
WTI Crude Oil Price Technical Analysis
On the hourly chart of WTI Crude Oil at FXOpen, the price started a fresh upward move from $59.45 against the US Dollar. The price gained bullish momentum after it broke the $60.00 resistance.
The bulls pushed the price above the 50% Fib retracement level of the downward move from the $62.76 swing high to the $59.45 low. The price even climbed above the 50-hour simple moving average. Besides, there was a break above a key bearish trend line with resistance at $60.80.
It tested the $61.50 resistance zone and the 61.8% Fib retracement level of the downward move from the $62.76 swing high to the $59.45 low.
The RSI is now near the 50 level and the price could aim for more gains. If the price climbs higher again, it could face resistance near $62.00. The next major resistance is near the $62.75 level. Any more gains might send the price toward the $63.45 level or even $65.00.
Conversely, the price might correct gains and test the $60.80 support level. The next major support on the WTI Crude Oil chart is near the $59.45 zone, below which the price could test the $58.00 zone.
If there is a downside break, the price might decline toward $56.50. Any more losses may perhaps open the doors for a move toward the $55.50 support zone.
This article represents the opinion of the Companies operating under the FXOpen brand only. It is not to be construed as an offer, solicitation, or recommendation with respect to products and services provided by the Companies operating under the FXOpen brand, nor is it to be considered financial advice.

Market Analysis: WTI Crude Oil TumblesMarket Analysis: WTI Crude Oil Tumbles
WTI Crude oil is down over 10% and remains at risk of more losses.
Important Takeaways for WTI Crude Oil Price Analysis Today
- WTI Crude oil prices extended downsides below the $60.00 support zone.
- A major bearish trend line is forming with resistance near $57.25 on the hourly chart of XTI/USD at FXOpen.
WTI Crude Oil Price Technical Analysis
On the hourly chart of WTI Crude Oil at FXOpen, the price struggled to continue higher above $60.00 against the US Dollar. The price formed a short-term top and started a fresh decline below $58.00.
There was a steady decline below the $57.75 pivot level. The bears even pushed the price below $56.20 and the 50-hour simple moving average. Finally, the price tested the $55.00 zone. The recent swing low was formed near $55.01, and the price is now consolidating losses.
There was a minor move above the $55.50 level. On the upside, immediate resistance is near the $56.10 level and the 23.6% Fib retracement level of the downward move from the $59.49 swing high to the $55.01 low.
The next resistance is near the $57.25 level. There is also a major bearish trend line forming with resistance near $57.25. The trend line is near the 50% Fib retracement level of the downward move from the $59.49 swing high to the $55.01 low.
The main resistance is near a trend line at $57.75. A clear move above the $57.75 zone could send the price toward $59.45. The next key resistance is near $62.25. If the price climbs further higher, it could face resistance near $63.20. Any more gains might send the price toward the $65.00 level.
Immediate support is near the $55.00 level. The next major support on the WTI crude oil chart is near $53.00. If there is a downside break, the price might decline toward $52.00. Any more losses may perhaps open the doors for a move toward the $50.00 support zone.
This article represents the opinion of the Companies operating under the FXOpen brand only. It is not to be construed as an offer, solicitation, or recommendation with respect to products and services provided by the Companies operating under the FXOpen brand, nor is it to be considered financial advice.

Us Oi moveUS oil is bullish untill not break the trendline, It's is taking support of trendline on daily timeframe, if it breaks the Trend line then another trendline will be support. Here are the levels as per price action.
Note: I am not SEBI REGISTERED analist, this is my personal view only for education purpose.

Important zone for selling in WtiWti is nearby resistance zone, rsi also heavy overbought, downfall expected per levels.
I am not SEBI registered analist, this is my personal view only for educational purposes.

Rising oil prices are under pressure, so be careful of trapsAlthough the interruption of some exports from the Kurdistan region of Iraq has raised concerns about tighter supply, the United States is expected to start strategic reserve repurchases during the year, which will also benefit oil prices to promote a rebound in oil prices.However, because of the geopolitical situation between Russia and Ukraine, it is more the West that sanctions Russia, so it will not allow oil prices to rise sharply and have sufficient income, thus limiting the room for oil prices to rebound to a certain extent.
From the perspective of crude oil trends, since the surge on March 27, there has not been a decent pullback and repair, so crude oil technically needs at least a second pullback to prove the effectiveness of the oil price increase.
Short-term trading reference: sell crude oil near 74, stop loss level 74.4, take profit level 73.3
In order to facilitate everyone to continue to follow up on my analysis and sharing, you can like and follow me; in addition, I will share the daily real-time strategy in the channel. If you can't follow up in real time, you may make operational errors.You can use the following methods to enter my channel for free to follow the latest news and follow up on market trends in real time.

views in dcb for CRUDEOIL MCXMCX:CRUDEOIL1! broke down a major support zone and now that support zone acting as a major resistance zone . upcoming strong support zone 4705-4200. upcoming trend will be sideways to downtrend.
Disclaimer - This chart analysis is only for educational purpose. Do proper research before trade/investment or consult with your financial advisor. This expressed opinion/view/analysis isn't a trade/investment advice/recommendation. SEBI unregistered independent trader/analyst.

My swing Full Margin Setup on WTI CRUDE OILThis setup taught by my awesome teacher, a legendary trader from Malaysia, Mansor Sapari.
But man, to get this setup, you need to have a very very strong patience. Of course this setup is not my only setup to trade.
In order to get a complete setup:
Must have
-fakeout
-compression
-cap price zone
-support resistance
-supply zone
-resistance become support
-breakout
-double maru candlestick
-divergence on MACD/AO
-some times it goes well if there's a news (fundamental aspect)
Sorry, my english is not very good to explain. But I'll to explain it in video next time.
Please help me to grow my youtube channel, I would like to share and help others in trading. I also need to learn more stuff.
Search & SUBSCRIBE my channel "The Musician Trader"

Crude Oil Intraday Trading Levels for Scalping - 29Sep2021Crude Oil Intraday Trading Levels for Scalping - 29Sep2021


#crudeoil sell again new forecast hi again dear traders check this out and contact us for learning forex and account management

CrudeOil Bullish Structure ConfirmationHere we go again! Crude oil's super mega uptrend looks to continue! Last time we saw a trend like this was 2009, and it's a long time coming after the major declines in 2014.
Quick summary why I'm bullish in the next weeks:
1. Overall bullish trend
2. Consolidate and form a higher low
3. Failed breakout lower, breakout higher
My next target is 75.50, and if we really move then 80 and 90 are still possible. The announcement of OPEC's higher production limits this Friday potentially puts a limit on the overall trend. Higher production with relatively constant demand (I mean we didn't just start needing 600k/day barrels more oil overnight) should weaken price. Will need to see this in the charts before I give it much weight.
So what do you think? Am I crazy to be so bullish? We've already moved so far...will it keep going? Share with me your charts, ideas, and comments! Love to hear other traders opinions!
Peace, love, and sweet bamboo,
tbp
Note: All ideas expressed here are presented solely for learning and educational purposes only. Any gains or losses assumed by trading ideas presented by The Bad Panda are done so at your own risk.

Don't let Trump talk fool you....crude's going higherIf you've followed me over the last little while you'd know that I've been bullish crude oil for the last 6 motnhs and man it's been and exciting ride! Good news is I don't think we're done yet! So there's still time to get in on the party.
My long term view is crude to 90 :D Although that's a ways off, and we might need to see some consolidation/retracement/market confusion before getting there. So what's happened so far? We formed a major support region in the 63.10 area and have recently broken out. I would typically expect us to continue higher, with the next targets at 71.50 and 75.50 respectively. Right now this my general outlook, and I'll be waiting for an entry to form this week expecting higher prices through the week. If it doesn't happen, I'll reevaluate before looking for a new long.
So what do you think? Am I crazy to be so bullish? We've already moved so far...will it keep going? Share with me your charts, ideas, and comments! Love to hear other traders opinions!
Peace, love, and sweet bamboo,
tbp
Note: All ideas expressed here are presented solely for learning and educational purposes only. Any gains or losses assumed by trading ideas presented by The Bad Panda are done so at your own risk.
