Crudeoilanalysis

Crude oil Price Limited Downside, Big Upside The trend is making a symmetrical triangle.
In the symmetrical triangle, you can see the trend is descending, and it will continue to fall up to the particular targets, which are shown in the charts (T1 2886 & T2 2800 ).
After knocking the lower ascending trendline with higher lows (support), It will bounce to the upper descending trendline with the lower highs (resistance). After that, If the trend makes consecutive candles, there will be an ascending trend. B ut don't sell if the trend falls and crosses the stop loss.

Crude oil Buy / Sell Based on Fibo and GannBuy at 2922 stop loss 2898 Target 2973 / 3033
Fibonacci and Gann always rocks support us follow us and research with us

CRUDE OIL SELL SIGNAL Heytradomaniacs,
welcome to another free trade-setup.
CRUDE OIL: Day-Swingtrade-Exexution
Sell-Stop: 39,71
Stop-Loss: 40,74
Target 1: 38,90
Target 2: 39,23
Target 3: 37,28
Target for One-Target-Trader: 39,23
Stop-Loss: 100 pips
Risk: 0,5% - 1%
Risk-Reward: 2,45
LEAVE A LIKE AND A COMMENT - I appreciate every support! =)
Peace and good trades
Irasor
Wanna see more? Don`t forget to follow me.
Any questions? PM me. :-)

CRUDEOIL / SHORTThis rubbish has finally broken its trendline, I missed the beginning of the move but once the next support level is broken you can still jump in for a short

Crude oil Forecast: Using Fibonacci Retracement LevelsWas That the Top in Crude oil?
Crude oil price is running nearby a 78.60% retracement level, and it can act as support. Hence, trade with the trend: sell positions executed around 78.60% retracement level area for the targets of 2660 – 2600 – 2560 – 2500.
For long-term investors: they can hold for 2410 – 2320 levels.
Don’t sell crude oil above the 2740 level. It can start raising for 2980 – 3260 levels.

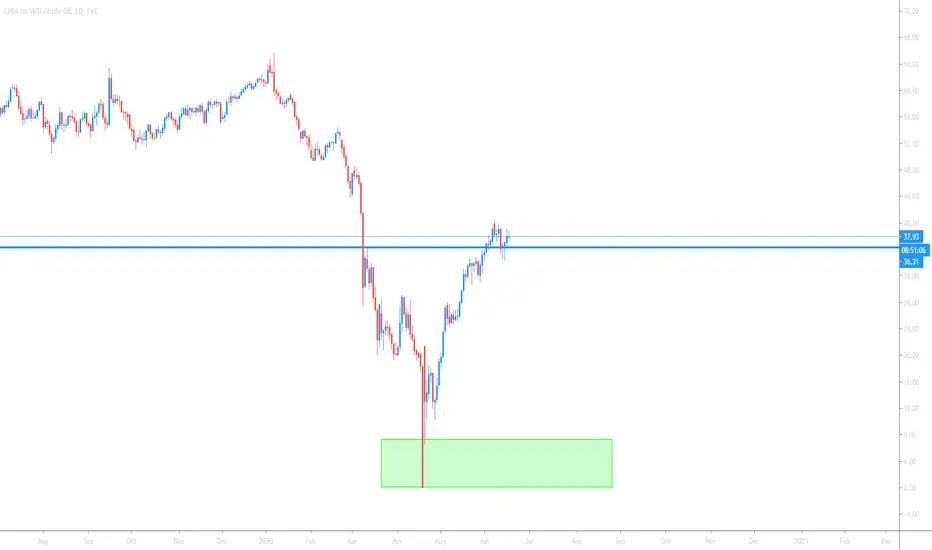
Where will oil go?Happy Friday oil traders! Let us pause for a moment and remember those who gave all 19 years ago today... Let us never forget! With that said oil appears to have dropped and is hovering around the June low. There is not much support at this price range so will it go up or continue to fall? I am not sure. I believe it wants to continue back up to its $40-$60 price range and will eventually get there. However, with the market as crazy as it is right now, I think we could see some further downside before that happens. If oil continues to drop I believe it will settle at a bigger support line around $30-$32 range. I hope this helps. Trade responsibly, and have a great weekend!

BRENT- 4h 50 EMA just crossed 200 EMA for the first time in 4 MoLet's see what we have:
50 EMA crossed below the 200 EMA
2h Chart: Sep 04, first time since May 05
3h Chart: Sep 07, first time since May 07
4h Chart: Sep 07, first time since May 18
1D Chart? 50 EMA was always below 200 EMA since January
In the 4h Chart 50 EMA crossed 200 EMA in the last hour of trading.
First time in 4 Months. If there are no unexpected news, the direction seem to be south.
Take it with a grain of salt, this market is highly risky, can go +$3 then -$3 in a few hours...

WTI Crude Oil Trading Strategy for this weekWTI Crude oil following the support trendline and dynamic resistance. At present, it's in an uptrend for short-term investors. According to this chart, the last descending triangle pattern is the broken upper side.
Still, we cannot trust this breakout because of excess at the support line. Buy position can initiate at 43 for 43.4 - 44 targets.
If WTI comes below descending resistance or at the red circle area, jump for 42 - 41.6 levels as a target.
Note: keep your eyes open at the uptrend channel.
I have updated a report on Gold on Sunday. Wherein I listed a few events/inventories that can affect to Bullion & Energy sector commodities. You must read that.

CRUDE - heading to an interesting SHORT Zoneis this the final excess on CRUDE before the first major correction since the run ? Lets see if we get a TOP around 45 ! no confirmation yet
no financial advise, only my idea !

WTI Crude OilWTI crude oil, the spring is wound (very low volatility in latter days), soon the price will shoot upwards

CRUDEOIL - KILLZONESimilar analysis as my other charts, Oil previously crashed and hit the bottom at this level. I see many indications that this will fall again and potentially hit the bottom.
Price is constantly testing support and now consolidating. Once price has broken support its a big sell.
Crude Oil Wave Analysis After a strong show in the last weeks, crude oil needs to make an obvious correction.
We expect the correction to be of ABC structure and it has already completed waves A and B.
Further, the structure resembles a bullish flag pattern and the price is at the upper parallel now.
Currently, the pair is forming a bearish flag pattern in the short-term charts and a break below could guarantee a safe entry to bears.
PS: Aggressive trades, refer to the resistance at 40.41 for the stop.

CRUDEOIL - SELLPrice has hit a key area (where it fell previously)
It will continue to consolidate before taking a HUGE drop

CRUDE OIL WILL GO DOWNThe Crude Oil has a big potential to go down .
Feel free to comment down below
If you like my ideas support me with a like


CRUDE OIL D1 oil price goes down sharply.
as you can see the price revores a bit but I do not think it goes far away.
I wait for another chance for geting short position.

USOIL Bullish ViewBroke the structure and it may gow up to the next resistance line
USOIL Buy at 58.50
Target Profit 60.76
Target Profit 63.20
Stop Loss 55.00
Maybe we may hold this for a longer period.
All the best,

Oil holds support well, a new high is coming up. Long CRUDE OILThe uptrend has been prevalent in crude oil with a slight hiccup early in December, otherwise higher highs and higher lows have occurred. The most recent was a break above the strong resistance at $58.70 and held it as support.
The candlesticks are really important in this analysis because the wicks are really pronounced and extended which suggests the buyers are in control to a strong degree.
The break and retest of the level at $58.70 was a break of a previous high and retest that held which confirmed the bull trend. We ticked the first upside target on oil at $59.90 and now we expect the next target level which is first at $60.50 then at $62.00 based on the Fibs.
One sign of concern is the volume is not the strongest on this rally higher and there are choppier candles that have printed which does not convince us too much of a direct path higher.
If the $58.70 support is broken and price continues lower, that breaks the trend.
Disclaimer: This idea is for educational purposes only, this does not constitute as trading or investment advice. TRADEPRO Academy is not responsible for any market activity.


CL bull channel holds, longs up to $59.60! Crude oil is still holding upside bull structure and it didn't even have to pull down into the $56.75 where the impulse started, the bottom of the channel at $57.35 held really well for the bulls to continue and the $57.85 held multiple times for the upside on rotations and wicks which indicates more upside.
The only part that may break up the upside trend is the triple top formation at $58.60, the high probability long would be a break above $58.70 and close, into $59.00 and retrace to the broken high and hold as support. If we get below $57.85 again we may be done with the long side.
Disclaimer: This is for educational purposes only, not recommended as trading advice or investment advice.

WTI Crude Oil bullish in the short-termWTI Crude Oil is moving within a bullish channel which in turn is located within larger rectangular congestion. Likely a retest of the resistance.

US OIL - Weekly chart - Bigger timeframes calling for big upsideCrude Oil - Weekly chart - I see crude trading in a bullish structure respecting weekly and monthly demand zones and looks like it can pull back upto 70s to test a fresh weekly supply zone. Lets see how this plays out!
