Crude Oil Long SetupOil Long Setup
Entry: $53.68
TP & RR: $57.65
Stop Loss: $52.57
REASONS FOR THE TRADE
Contrary to most expectations that Oil was overpriced, it continues to trend up. I won't open a long order at the current level, nor would I short obvious strength. However, if price retraces back to previous resistance, which is now support, I am more than happy to buy. I believe we are now in a channel and we are yet to see how we go through the awaited $55-$56 level.
With that being said, we may not get filled at all. Should this be the case, we will be targeting the upper channel with a short order.
Crudeoilforecast

Oil Lower High Formation - Short TradeOil Lower High - Short Order
Entry: $53.55
TP & RR: $51.05 (2.38)
Stop Loss: $54.60
REASONS FOR THE TRADE
Oil has entered into a bit of a range recently, but the formation of the lower high on Friday makes me think that we are about to see another lower high, which should then form a lower low. This is where we will be looking to take profit. The Stop Loss is set well above the highest high, so if we are to break that level, then we have clear invalidation of the setup. So, pay attention to the price action around this area, and should it break it, feel free to close the trade prematurely.
The wide SL is purely for decreasing the position size, as I don't want us to lose a full 1% on a trade without a clear signal from my indicators.

Oil Descending Channel - Short TradeOil Descending Channel - Short Position
Entry: $53.16
TP & RR: $51.61 (2.77)
Stop Loss: $53.72
REASONS FOR THE TRADE
Similarly to my previous trade idea about SPX500 from today, I am placing an alert at $53 and I will be patiently waiting to see how price action develops. You never know what's been going on in the traders' and investors' heads over the weekend, so we want to see the volume and a 1h close around that level before opening a position.
I believe we are now in a downtrend channel, which should bring more balance to that longer-than-expected move up. My entry is quite high and we very much may miss it, so I have highlighted the upper trendline as an entry-level suggestion. Any position around that level with a SL place reasonably high should provide a good trade setup. Ultimately, I am expecting that we reach the $49 level (bigger trendline) before we move up again.
Let me know what you think in the comment section below.
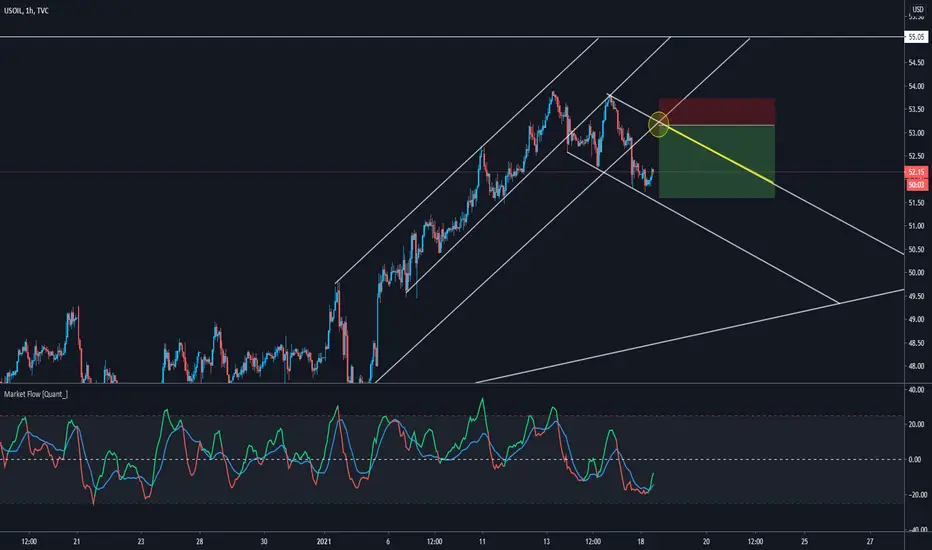
Oil Ready For a ReversalConsidering it's Friday today, I decided to post a general analysis on Oil as opposed to a specific entry-target-stop loss idea as I usually do. I refrain from keeping positions over the weekend as a lot can happen and I don't want to be overexposed. So, if it's not a setup that I feel very confident about, I rarely open trades on Friday. With that being said, here's what I am expecting to happen and I will continue to analyze over the weekend.
As most of us have noticed already, the bulls seem to be a bit exhausted from this move up and I am expecting that soon the demand for oil will decrease. As a result, we should see the bears taking control of the situation and push the price down. On a daily chart, we are reaching the overbought level, while on the 4h chart we are about to print a divergence (following my indicator Market Flow for this analysis).
I am expecting one last push up until we reach the next strong resistance (from a psychological and technical standpoint) of $55. Before we take a dive, I believe that price may go slightly above that level so that the Stop Losses are triggered and provide liquidity for the big players' short positions.
I see two other possible scenarios, although I wouldn't bet my money on them at this moment:
1) Oil breaks down from this ascending channel prematurely and starts a downtrend or starts ranging;
2) Price reaches the resistance level, makes a small pullback, and prepares to penetrate that level. If that is the case I believe we can see quite a big move up.
How do you guys see the situation? Let me know what you think in the comment section below.

WTI Crude Oil (cl2!) SHORT; Drop to < $20 is imminent! SELL!!This is clearly on it's way to <$20 before the summer.
MOEX:CL2!
Here is the Daily

Identifying the Crude Oil Price Next Big MoveAccording to this chart, MCX crude oil is trying to climb upward. It has started upside rally from the beginning of May.
Here, I have applied Volume, DMI, MA, and Fib Retracement to identify the next move. Moving average of 50 & 200 is throwing direct up signals by crossover. And here, ADX is less than 25 but +DI above the -DI. Hence, we have chances to see slow movements.
Smart investors can buy for 3260 - 3300 - 3360 - 3400 levels.
In the previous trading session, it has created a Doji. It’s a direct sign of a reversal or trend continuation. But if it breaks the support line, the crude oil will fall to 88.6% (2982) - 78.6% (2735) of Fib retracement levels.

Crude oil Buy / Sell Based on Fibo and GannBuy crude oil at 2963 Stop loss 2940 Target 3018 / 3043
Fibonacci and GANN always rocks follow us support us and research with us

Crude oil Buy / Sell Based on Fibo and GannSell crudeoil at 3026 Stop Loss 3049 Target 2972 / 2947
Fibonacci and GANN always rocks follow us support us and research with us

Crude oil Buy / Sell Based on Fibo and GannSell crude at 3059 Stop loss 3086 Target 3010
Fibonacci and GANN always rocks follow us support us and research with us

Crude oil Buy / Sell Based on Fibo and GannCrude oil sell at 2997 stop loss 3019 Target expected 2940 / 2879
Fibonacci and GANN always rocks follow us support us and research with us

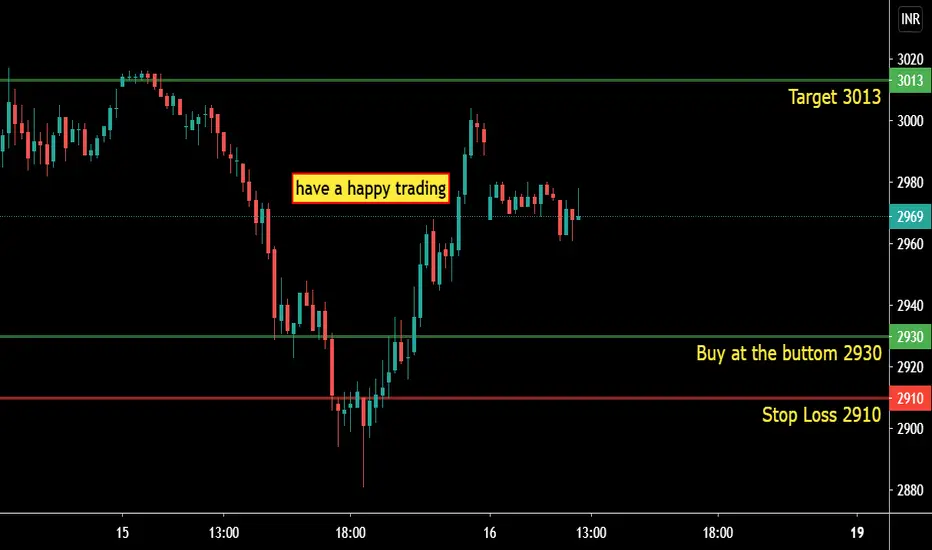
Crude oil Buy / Sell Based on Fibo and GannBuy crude oil at 2930 Stop loss at 2910 Target 3013
Fibonacci and Gann always rocks follow us , support us and research with us
Crude oil Buy / Sell Based on Fibo and GannSell crude oil at 3018 stop loss at 3037 and expected target 2989 / 2974
Fibonacci and GANN always rocks follow us support us and research with us

Crude oil Buy / Sell Based on Fibo and GannBuy crude at the bottom 2922 Stop loss 2905 Target expected is 2966 / 3015
Fibonacci and Gann always rocks follow us support us and research with us

MCX- Crude Oil Weekly analysis Hello everyone.
Crude oil also bullish and it has a good buying opportunity. Consider long above 3030 stop loss: 2948 Target : 3118

Crude oil Buy / Sell Based on Fibo and GannBuy at 2815 stop loss 2785 Target 2876 / 2948
Fibonacci and Gann always rocks support us follow us and research with us


Sell: 39.47
Real-Time Algorithmic Trading Signals. All trades are based on a Geometric HMM.
The Ingenuity Trading Model is a Geometric Hidden Markov Model with specific inputs related to Price, Time, Volume , and Volatility .
Our Algorithmic Trading Model offers real-time buy or sell signals with specific entry and exit prices. This affords you the freedom to successfully trade across all markets and market regimes. We are not interested in biased economic research or opinions on the latest Wall Street narratives. We do not trade based on conventional financial analysis. Our signals prove the power of taking a more scientific approach to trading the market.

UKOIL BRENT Nose-dive to $32 and beyond?After the 2h 50 EMA crossed below the 200 EMA first time since May 05, 2020,
the 3h 50 EMA crossed below the 200 EMA on Sep 04, first time since May 07, 2020.
What exactly can stop oil from going diving back to low $30's ? More cuts from OPEC?
Winter coming to the Northern Hemisphere? Miracle vaccine ?
Doubt it. Let's see...

CRUDEOIL / SHORTThis rubbish has finally broken its trendline, I missed the beginning of the move but once the next support level is broken you can still jump in for a short

WTI Crude Oil Trading Strategy for this weekWTI Crude oil following the support trendline and dynamic resistance. At present, it's in an uptrend for short-term investors. According to this chart, the last descending triangle pattern is the broken upper side.
Still, we cannot trust this breakout because of excess at the support line. Buy position can initiate at 43 for 43.4 - 44 targets.
If WTI comes below descending resistance or at the red circle area, jump for 42 - 41.6 levels as a target.
Note: keep your eyes open at the uptrend channel.
I have updated a report on Gold on Sunday. Wherein I listed a few events/inventories that can affect to Bullion & Energy sector commodities. You must read that.

WTI . Weekly Technical Analysis UpdateMidterm forecast:
While the price is below the resistance 43.60, beginning of downtrend is expected.
We make sure when the support at 30.85 breaks.
If the resistance at 43.60 is broken, the short-term forecast -beginning of downtrend- will be invalid.
Technical analysis:
There is a divergence in RSI and price between the peak at 40.565 on 2020-06-08 and the peak at 43.595 on 2020-08-05, the probability of uptrend continuation is decreased and the probability of beginning of downtrend is increased.
While the RSI support #1 at 52 is not broken, the probability of price decrease would be too low.
A peak is formed in daily chart at 43.60 on 08/05/2020, so more losses to support(s) 42.30, 38.85, 37.15 and minimum to Major Support (30.85) is expected.
Price is above WEMA21, if price drops more, this line can act as dynamic support against more losses.
Relative strength index (RSI) is 60.
❤️ If you find this helpful and want more FREE forecasts in TradingView
. . . . . Please show your support back,
. . . . . . . . Hit the 👍 LIKE button,
. . . . . . . . . . Drop some feedback below in the comment!
❤️ Your Support is very much 🙏 appreciated!❤️
💎 Want us to help you become a better Forex trader?
Now, It's your turn!
Be sure to leave a comment let us know how do you see this opportunity and forecast.
Trade well, ❤️
ForecastCity English Support Team ❤️

Crude Oil - Launch PadCrude Oil sold off today at first however, traders decisively bid the price back up above the 200 day EMA.
Note: The light blue 50 EMA on this 4hr chart is equivalent to the 200 day EMA
This bullish price action tells me that the 200 day EMA is now the launch pad for traders to take this to the next level up. Most likely that would be the 50 week EMA around $43.25 - Depending on the reaction to this level, I'll sell or hold. Could be a short squeeze coming.
Further, the MACD is crossing right at the zero line which indicates bullish momentum.

Crude oil Buy / Sell Based on FIBO / Gann - INTRADAYAs per my analysis Crude oil is on Buy Trend correction ,
So Sell near 3150 Stop loss level at 3172 Target Expected 3116
Buy near 3116 stop loss 3088 target 3167 / 3233
NOTE BUY IS THE MAJOR TREND FOR TODAY AS PER MY IVEW
Gann And Fibonacci Always rocks Follow us and support us and help us to grow
