Crude oil Buy / Sell Based on FIBO / Gann - INTRADAYAs per my analysis Crude oil is on Buy Trend , So Buy at 3095 Stop loss level at 3065 Target Expected 3148 / 3174
Gann And Fibonacci Always rocks Follow us and support us and help us to grow
Crudeoilforecast

Crude Oil - Technicals AloneThere's too much noise. Covid lockdowns, vaccine hopes, China trade retaliation, etc.
Technicals:
There was a break out of the wedge that most traders have drawn out however, I think it's more likely price breaks back down in order to build momentum for the next move higher. Ideally, there could be some good buying opportunities around the 200 EMA on the 4hr chart.
If I'm wrong then I'd like price to break above the previous high, $41.63, before I start buying.

Crude Oil Wave Analysis After a strong show in the last weeks, crude oil needs to make an obvious correction.
We expect the correction to be of ABC structure and it has already completed waves A and B.
Further, the structure resembles a bullish flag pattern and the price is at the upper parallel now.
Currently, the pair is forming a bearish flag pattern in the short-term charts and a break below could guarantee a safe entry to bears.
PS: Aggressive trades, refer to the resistance at 40.41 for the stop.

CRUDEOIL - SELLPrice has hit a key area (where it fell previously)
It will continue to consolidate before taking a HUGE drop

US Oil :Correction likely to complete around 32.50 - 31.25 April 2020 low to the short term high around the 40 handle , Us oil likely to complete its correction around the 50 day exponential moving average around 32.50 or slightly below it . As of now , its testing the 100 day exponential moving average around 35.50 and price likely to consolidate until Thursday as the investors waiting for output from the JMMC/OPEC meetings . World stock indices and crude oil gave up the invincible gain since the crash as investors saw the domination of risk aversion/Powell comments on the last FED meeting.
Major levels to consider are :
35.50 - EMA 100 , breaking this level will let the price to drop further towards the 50 day EMA around 32.50 on the other side if this 35.50 short term supports holds then we can expect another leg up towards the 200 day EMA around 42.50

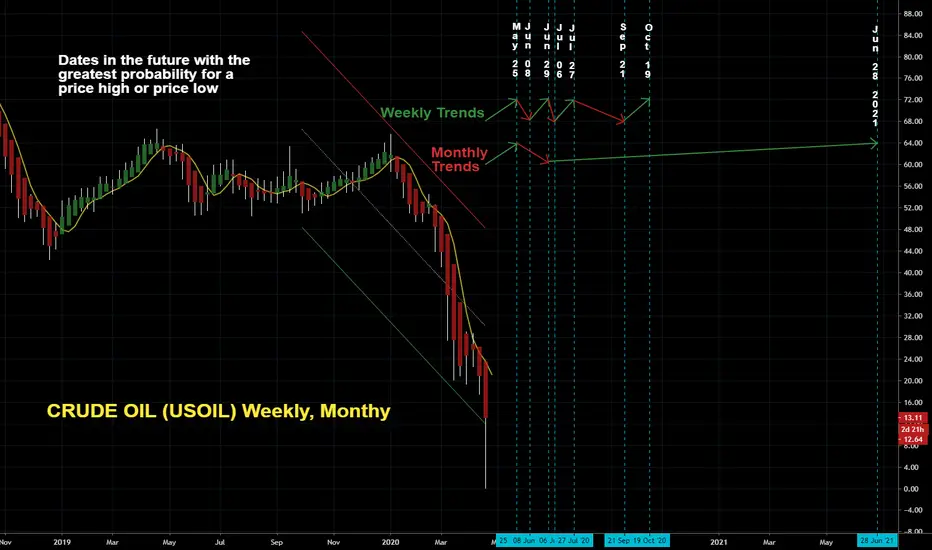
CRUDE OIL (USOIL) Weekly, MonthyDates in the future with the greatest probability for a price high or price low.
The Djinn Predictive Indicators are simple mathematical equations. Once an equation is given to Siri the algorithm provides the future price swing date. Djinn Indicators work on all charts, for any asset category and in all time frames. Occasionally a Djinn Predictive Indicator will miss its prediction date by one candlestick. If multiple Djinn prediction dates are missed and are plowed through by same color Henikin Ashi candles the asset is being "reset". The "reset" is complete when Henikin Ashi candles are back in sync with Djinn price high or low prediction dates.
One way the Djinn Indicator is used to enter and exit trades:
For best results trade in the direction of the trend.
The Linear Regression channel is used to determine trend direction. The Linear Regression is set at 2 -2 30.
When a green Henikin Ashi candle intersects with the linear regression upper deviation line (green line) and both indicators intersect with a Djinn prediction date a sell is triggered.
When a red Henikin Ashi candle intersects with the linear regression lower deviation line (red line) and both indicators intersect with a Djinn prediction date a buy is triggered.
This trading strategy works on daily, weekly and Monthly Djinn Predictive charts.
Trades made when the weekly and monthly arrows are pointing in the same direction are the most profitable.
This is not trading advice. Trade at your own risk.
CRUDE OIL D1 we have strong bearish candle, today we had negative news around oil and demand of that
if the price goes down below 49.3 it opens door for going lower and reaching to 48
I am looking for selling opportunity

CRUDE OIL D1 oil price goes down sharply.
as you can see the price revores a bit but I do not think it goes far away.
I wait for another chance for geting short position.

Oil rally off news, to continue to $65! Crude oil prices skyrocketed from the news that there was an attack on an Iranian militant in Iraq which increased tensions and caused oil to pop. Oil was already on a tear to the upside and market structure suggested long side, this just gave price a little jolt of energy. Tensions may continue to rise but market structure is still saying upside. The break above the top of the channel ensured the upside. The bottom of the channel and support structure held really well on the intraday with a double bottom at $60.70-$60.80.
From the break of the previous high at $62.30 and the break of the channel we have now experienced a pullback into that area for a continued move higher. The $62.30 level held as support really well after hitting the $64.00 area. The next target is $64.00 yet again which is the 150% Fib extension area so target 1 was hit. The next target is the 200% Fib extension at $64.98.
Should price break below $62.30 there is a potential for a pullback into the support at $61.00 where the impulse from the drive higher started.
This idea is for educational purposes only, this does not constitute as investment or trading advice. TRADEPRO Academy is not responsible for any market activity.

Bullish oilDeleted the last one because i realised the cypher wasn't accurate at all, overall oil looks bullish and continuation / reconfirmation of a long term uptrend is being established.

CRUDE OIL - Monthly chart - THE BIG LONG CrudeOil - I see monthly charts calling for a big upside on crude and this fits well with the timing of the Saudi Aramco IPO recently. $100 targets next year

WTI Crude Oil Preparing for OPEC MeetingThe West Texas Intermediate Crude Oil market initially tried to rally during the trading session on Monday, bouncing from the uptrend line and reaching towards and above the 50-day SMA initially. The crude oil market kick off the week with rally, as an Iraq oil minister suggested that not only would OPEC continue its production cuts, but it would possibly even consider cutting an additional 400,000 barrels a day. The rally ran into a brick wall though as President Trump announced new tariffs in Latin America and threatened new ones on Europe.
At the end of the day Brent crude and WTI gave up their gains to finish almost unchanged. Now WTI crude oil is showing convergence with its hourly 20 SMA and trading below its 50 SMA on the same chart.
Near-term action is weighed by Friday’s massive bearish daily candle, with Friday’s close below 38.2% Fibo support at $55.78 (on last 2 months rise of $50.55 to $58.71) adding to negative near-term tone, which is expected to persist while recovery attempts remain capped by daily high ($58.15).
It is because of this that the $55 level underneath will offer plenty of support, but if it does in fact get broken, the market should goes down towards the $52.50 level (78.6% Fibo).
On the upside, the daily 200 SMA line remain relevant and are additional barriers against upward movement. The first resistance is at 56.50. Next is resistance from the 200-EMA at 57.51.
Overall, we believe that the market is going to continue the overall uptrend and channel for the rest of the week, but it will more than likely be very choppy, and news driven.


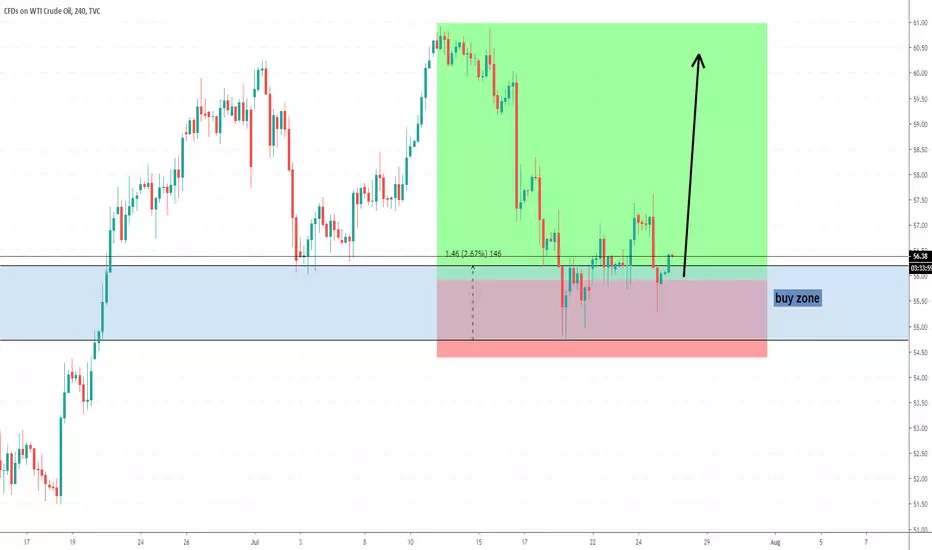
US CRUDE OIL - H4 - Buy setupCrude oil - H4 chart showing buyers in control with price continue to make higher highs and higher lows while leaving behind fresh demand zones.. Buy limit set at 57 with stops below 56.20 and take profits 60-61... Enjoy

US OIL - Weekly chart - Bigger timeframes calling for big upsideCrude Oil - Weekly chart - I see crude trading in a bullish structure respecting weekly and monthly demand zones and looks like it can pull back upto 70s to test a fresh weekly supply zone. Lets see how this plays out!

Oil prices have spiked more than 10%|Next rally can hit $75.24On 13 Sep 19, Market closed on $54.87 but Oil prices have spiked after a destructive attack on the Saudi Arabian oil production on weekend shocked markets and produced shortage in global supply of crude for some time.
Now we can see the price spiked more than 10% in a day after market opens and hits the 50SMA even the 100SMA on week chart.
At this point we also have the price resistance level and the pennant's resistance at $60.63 which is not broken since May 2019, if this resistance level would be broken then the price action will take no time to reach the 2nd resistance at $75.24 where we also have tail of the pennant and in case of breaking out $75.24 resistance level the price action can hit the strong resistance at $107.45.
If we see the technical indicators then can be clearly observed that the all of a sudden the chop zone is turned strong bullish and even MACD has given strong bullish signals including bull cross.
For me after breakout the 1st resistance and if all indicators would be remained bullish even after price correction would be ideal for buying.
Market fundamentals + technical analysis are very strong in favor of bullish move.
Next target should be : $75.24.
Regards,
Atif Akbar (moon333)

Crude Oil Forecast: China to tax U.S OilWe have reached our near term target level 53.20.
Lack of Global Oil demand
Slowing down global economies
And now China's Plan to tax US Oil starting September 1.
As I mentioned in my previous Oil report, China- Iran Oil Trade Plan could be validated soon.
After the false breakout of the triangle, we see WTI retesting the triangle. WTI needs to make Daily Closing below 53.13 to continue its bearish move.
Under the current fundamental conditions, I expect the decline in oil prices to continue. As shown in the chart, Daily Closing below $ 50 will accelerate the downward trend in prices. Below 50$, Oil Prices may find medium-term support at 46.80.

now i am buyer like banks now i get confirmation that crude oil gonna go higher
check out bank levels and join us
enjoy profit
Crude Looks Short Near 58.80 with SL 59Watch The Fib Level and Trendline and then Trade If Crosses Then Close Trade Wait For Higher Levels To Get Active Most Probably Crude Might Not Cross 59.64

CRUDE OIL H1 Chart OverviewMarket is closed.
Let's have fun:-)
Supply Cut Extension
ARAMCO IPO
Iran Sanctions
Slowing Global Economy and Global Growth Concerns
Decreasing Global Oil Demand
Follow the lines and arrows

Crude Oil Forecast: How deep Oil Prices may fall?The shortened version of our Crude Oil Forecast:
We have started to sell Crude Oil at 65 $ and reached our target at 52.80 $.
What is next?
What were the reasons for the sell-off? What is driving the market?
1. The supply and demand balance strongly indicates that oversupply will last for some time to come.
2. Global Growth concerns. I have mentioned several times that WTO and IMF reduced their global growth projections. Parallel to this, both IEA, WTO and OPEC lowered their global oil demand estimates.
3. Trade Wars.
4. OPEC+ supply cut, Venezuela and Iran Sanctions did not help Crude Oil prices to enter into a bullish market. ( Closing above 68 $ ). Note the sanction waivers. Now Crude Oil prices have reached a critical level. We have to scenarios ahead. OPEC is to maintain cuts or face a world of much lower crude prices ( Then comes a war between OPEC and US Drilling Companies with 42 $ production cost).OPEC postponed their meeting for the supply decision. OPEC may wait for “right on time” action. ( 40 $ – 45 $ per barrel )
5.Brent/ WTI spread may widen intermediate term.
As I have been writing for three months, Crude oil is fundamentally and technically bearish. Supply is surpassing demand and stocks are rising at a time when they should be falling.
Please pay attention to The US Commodity Index. The double top pattern’s completed and the pattern suggests further fall.
Daily Chart:
Potential Golden Cut of MAs indicates a bearish move intermediate term.
A Bullish Bat Pattern and oversold RSI indicate a technical correction towards 57 $ near term. Potential pullbacks can be used as a selling opportunity.
On the downside 51.50 ( Fibonacci 61.8% of the latest bullish move ) and 50.00 $ (psychological level) will be our main focus.
On the upside, 56.25, 58.10 are the potential pullback levels to be used for selling opportunity.
Intraday trade opportunity will be published later for the members.

Short Usoil (Crudeoil wti)So, I posted a chart this morning and oil has moved further up which is within calculations and if this chart also fails, then I will post my new opinion on Monday. For now, happy trading. My sl is at 64.51 for leg B to C
DISCLAIMER
Please note that this chart is an opinion based chart only. Please trade at your own risk
