CRUDE OIL D1as all of you know yesterday oil broke the very important level 50$
the price does sharply to down side
coronovirus, supply&demand problems, closing china s factories I do not think oil price can recover
I am looking for selling opportunity, I am just seller
Crudeoilshort

CRUDE OIL D1 oil price goes down sharply.
as you can see the price revores a bit but I do not think it goes far away.
I wait for another chance for geting short position.

China impact on oil price - 2020 ForecastIf you like this idea, don't forget to support it, clicking the Like Button!
Do you know what are the 15 countries that imported the highest dollar value worth of crude oil during 2018?
China: US$239.2 billion (20.2% of total crude oil imports)
United States: $163.1 billion (13.8%)
India: $114.5 billion (9.7%)
Japan: $80.6 billion (6.8%)
South Korea: $80.4 billion (6.8%)
Netherlands: $48.8 billion (4.1%)
Germany: $45.1 billion (3.8%)
Spain: $34.2 billion (2.9%)
Italy: $32.6 billion (2.8%)
France: $28.5 billion (2.4%)
Thailand: $28.4 billion (2.4%)
Singapore: $28 billion (2.4%)
United Kingdom: $26 billion (2.2%)
Taiwan: $23.4 billion (2%)
Belgium: $19.5 billion (1.7%)
Now, these data are related to 2018, and it's easy to understand how the first four countries have a great impact on oil price, and how China could influence oil price (that, at this point, is influenced by China's economic development).
In 2019, China broke records for crude oil imports, importing more crude oil than the U.S. did at its peak.
We all know that oil price is affected by high volatility (I am a supporter of the "Rollercoaster Theory" XD). However, oil price increased thanks to increasing China's demand (one of the most important factors), combined with scarcity from the suppliers.
Despite this, there is a high risk that China's oil demand could halve this year (2020) generating a lower global oil demand for about $100 billion. If supply is maintained at the same levels, I will expect oil to be cheaper, at least in the first half of 2020.
From a technical point of view, the broke of the $57.11 support could realize the beginning of an important downtrend. If China confirms this information, traders will not be late to open their short positions.
Investing Fellow
Disclosure: My ideas contain statements and projections based on assumptions on capital markets, and therefore inherently subject to numerous risks and uncertainties.
Before buying or selling any stock you should do your own research and reach your own conclusion or consult a financial advisor. Investing includes risks, including loss of principal.
I am not a financial advisor.

Crude oil falls from heights! Next level $57.50?In our last analysis, we were targetting $65.50+ on oil and we got our profit target with a little help from the increased Middle Eastern tensions. From there the news subsided for the most part (tensions still high) and everything was priced in. Causing Oil to regulate back down to the "normal" levels. Price plunged through all the immediate support levels. Through $62.50, $61.00 and even $59.50.
From here there are two short term opportunities. The bulls or the bears.
The current intraday price action suggests there's more downside with the descending triangle. First the support structure at $58.70 has to collapse for price to continue to lows. We could see price use that broken support as resistance on the retrace which will confirm the downside. The downside target is first at $57.85 then $57.00.
There could be a late run by the bulls through the immediate resistance. If price moves above $59.65 and holds it as support on the retrace we could see $61.00 oil yet again. The downside volume is, however, coming out pretty aggressively.
This idea is for educational purposes only. This does not constitute as trading or investment advice. TRADEPRO Academy is not responsible for any market activity.

Bullish oilDeleted the last one because i realised the cypher wasn't accurate at all, overall oil looks bullish and continuation / reconfirmation of a long term uptrend is being established.


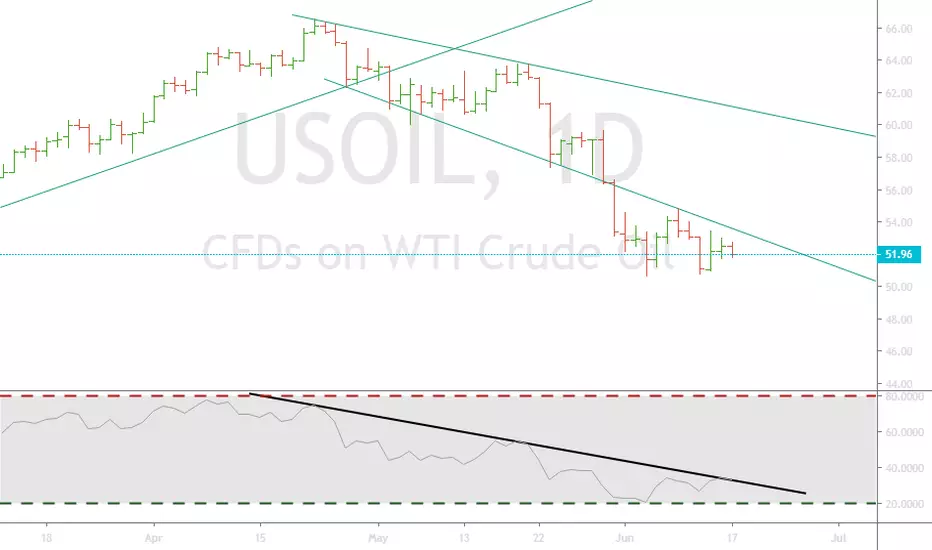
Crude Oil breaks bull structure, will we see $50.00 oil? Over the past few weeks, oil was making some gains slowly to push up from the lower $50.00 level and nearly into $60.00. There was some technical stagnation just under $59.00. A triple top had formed and we were waiting to see if support would hold for a push through resistance into $60.00, then the news came out from OPEC and OPEC+ that brought a strong 5% drop in the price. Through all support structure that was supposed to hold for upside. The bull trend is officially broken, which means we are looking for level at which to short CL to a move lower. The news is short-term however we may an extended move lower in the coming days or weeks. The first support level was $57.40, however price closed at $55.45 on Friday's close, right at support.
The next level for the retrace based on the market structure is around the 50% retrace move from the whole downside and the previous support level is broken ($56.75). The year to date POC is at $56.50 so there is a 25 cent range between those levels that could be a good area of resistance for the shorts. Above that, we may start looking for longs again. The target to the downside is $54.05.


USOIL on a weekly chartI know 3-4 months might be a pretty long time, but this is what I see for USOIL in the following months.
However, between the open of market tomorrow and about Tuesday, I am looking to SELL USOIL to around $56.4. Aiming to take profit around $57.4, $56.9 and $56.4 on very short term basis.


CRUDE OIL: Dax-Swingtrade-OpportunityHey tradomaniacs,
welcome to another free signal in WEEK 35 Setup Nr . 11!
How to trade: Wait for the market to break below the resistance-zone before you sell
If you see rejection after retest - SELL.
-----------------------------
Type: Day-Swingtrade
Sell here: 55,39
Stop-Loss: 56,48
Target 1: 54,34
Target 2: 53,77
Target 3: 53,29
-----------------------------
LEAVE A LIKE AND A COMMENT - I appreciate every support! =)
Peace and good trades
Irasor
Wanna see more? Don`t forget to follow me.
Any questions? PM me. :-)

now i am buyer like banks now i get confirmation that crude oil gonna go higher
check out bank levels and join us
enjoy profit
Crude Looks Short Near 58.80 with SL 59Watch The Fib Level and Trendline and then Trade If Crosses Then Close Trade Wait For Higher Levels To Get Active Most Probably Crude Might Not Cross 59.64

Crude is Under Bear Trend Might Probably 53.60 is the ResistanceI Donno If am Right But This Signals Me SHORT With an SL 53.80 ( or ) Wait Near 53.80 For Selling

Crude Oil (WTI USOIL) Short IntradayThis is my opinion based chart, market may still go up a bit more before coming down or we have hit the top at 62.32. Enter and exit at your own risk.
DISCLAIMER
Please note that this chart is an opinion based chart only. Please trade at your own risk

Crude Oil (WTI USOIL) Short IntradayIt has been a rollercoaster day and oil seems to have finally stabliased but don't take my word for it as oil has a mind of it's own. The yellow lines are my TP lines. Enter and exit at your own risk.
DISCLAIMER
Please note that this chart is an opinion based chart only. Please trade at your own risk

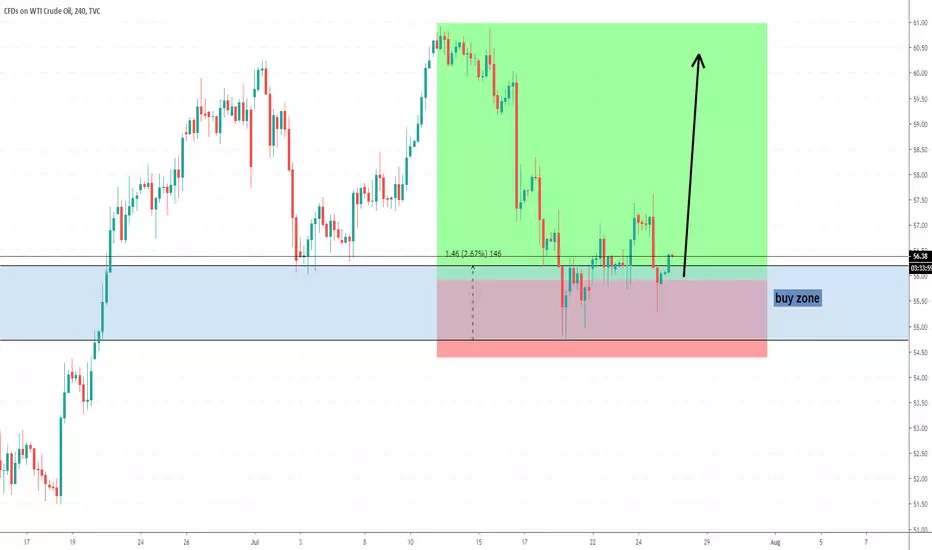
USOIL Harmonic Crab Pattern Analysis and Strategy UpdatePrice action has moved as we predicted since our last analysis. Major resistance was not broken and price action fell to start the completion of the crab pattern. We are continuing to trade the 4th leg of the pattern and our final take profit is set at the green zone. TVC:USOIL

USOIL Harmonic Crab Pattern Analysis and StrategyCrude oil is currently trading at a major resistance zone (red zone) and we are predicting the deep harmonic crap pattern showing on the 4 hr chart will be completed. Our strategy is to trade the 4th leg of this pattern. Price action has already reversed from the red zone giving our strategy confirmation. We have set our take profit at the green zone @ $59.50.
TVC:USOIL

USOIL short! - EQYUIY.Dear traders,
So as you can see we expect USOIL to go short. We think it will go short because the markt is now in a strong weekly supply zone. If you zoom in on the daily chart you can see we are now also created a new strong supply zone that’s been filled right now.
It will be much clear on the 4h chart, you can see the 4h trendline is been broken and a new 2 demand levels are created. We will wait when it will reach one of these zones and watch for some conformation to take is short.
For take profit levels and stoplos check our telegram group: t.me
NOTE; if you follow our telegram group you will be always up to date about the last market trades and conditions. This is not everything, there is a lot more in the telegram group:
What can you expect from us in the telegram group?
-A watchlist video. This will be uploaded every Monday in the morning.
-Trade setups. We only share high probability trade setups.
-At the end of the week we will upload a market recap video. This means that we will look back at the trade setups we have discussed in the trading group.
- Mini lessons about our strategy and mindset
Furthermore, we have created this Equiy trading community group, because we want to create a community in which you can ask us questions, but also other people in the trading group. In that way we can grow as a community. We will share the link to this group in this message: t.me
So, we hope you will enjoy this whole idea and that we will grow together!
Team Equiy.
