Crude Oil Elliot Wave Idea (Smaller TF)Maybe done with up move here at 2.618 of wave 1 reached at 5678.
Possible wave 4 .382 retrace to 5607 before wave 5 1.618 extension to 5622 which would complete a larger wave 1.
Crudeoilwti

Crude Oil Elliot Wave Idea (Update)Plotted more potential waves.
Wave 5 of a larger 3 to $5981.
Larger wave 4 0.382 retrace to $5574.
Larger wave 5 1.618 extension to $6232

Crude Oil EW IdeaPossibly starting wave 5 to 59+.
Wave 3 2.618 extension of wave 1 and popped out of the channel.
Wave 3 0.382 retrace and back to the bottom of the channel.
Wave 5 1.618 extension of wave 4 to top of the channel.

US Oil - Sideways Correction Hints Further AdvancesLast week price traded into and through our target and key resistance at 56.86 and is currently holding as support. As long as support holds we are looking for longs up towards the next key area of resistance at 58.79.

US Oil - Uptrend IntactOil continues its Bull trend with a correction towards the upward sloping trend line providing a great place to look for Bullish patterns for longs up towards the targets of 56.86 and 58.79 respectively.

US Oil - Bull FlagWe start the week with US Oil above broken resistance at 52.73 with the pole of a potential Bull flag forming. A correction (the flag) back towards the 52.73 area of resistance turning support will provide a great place to look for Bullish formations and patterns for longs up towards the next key areas of resistance and targets to the upside at 54.48 and 55.23 respectively.

US CRUDE OIL - H4 LONGSCrude Oil H4 time frame- I prefer longs on oil due to the simple bullish structure on all timeframes targets 54
US Oil - Counter Trend Line BreakLast week US Oil broke above the counter trend line and starts next week above the key area of support at 51.52 as well. Any correction will provide a great opportunity to look for Bullish formations and patterns, looking towards a target of 52.73.

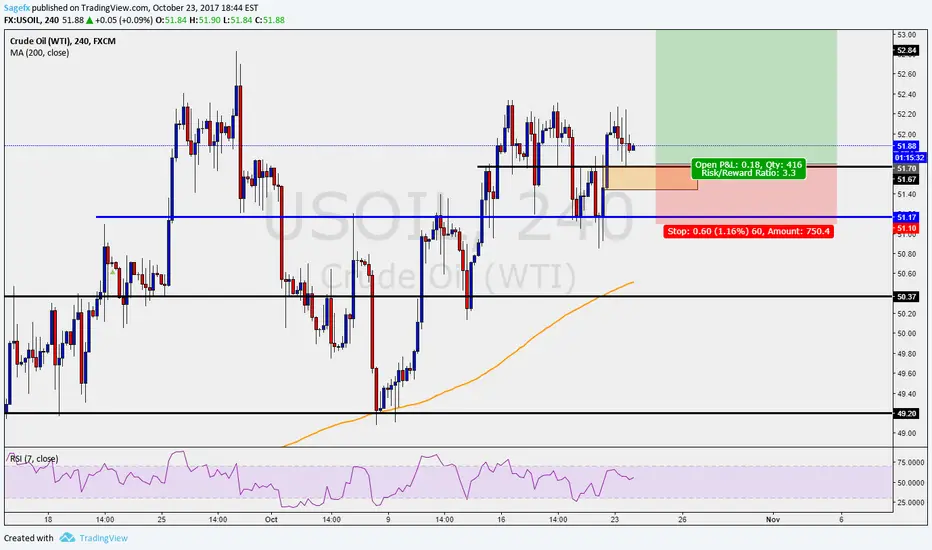
Crude Medium TermThis is a follow up to my crude medium term idea (please see the related idea link below to view the original idea), So far buy orders were filled at 49.22 for a target to 53.94, momentum looks to be slowing and it is likely that we may see a dip, to me dips will be good opportunity to build the position. So i am still holding my bullish stance on crude.
Strategy: Rebuy on dips to build the position, while move the stop to b/e for 49.22 filled orders.


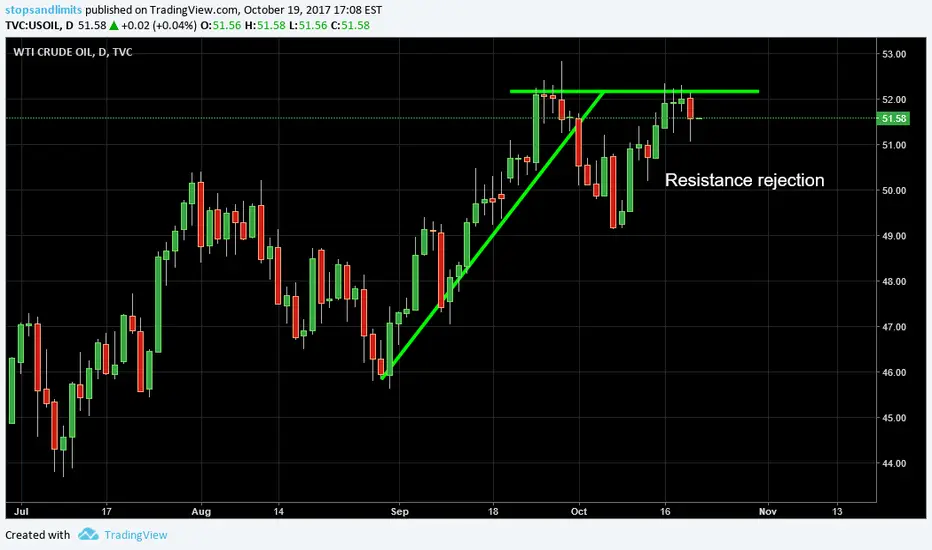
19/10/2017 US Oil Analysis"Oil drops more than one percent on profit taking after four days of gains" www.reuters.com
US Oil - Bear Flag?Last week Oil sold off below the key area of support at 50.33. This week we look for further declines in Oil with a retest of the 49.94/50.33 area of (now) resistance providing a great place to look for potential shorts down towards the target of 48.59.


Crude-OilThis is an update-that my short position at 52.10 from last week is going well in my analysis direction. I am looking to bank my position at 50.08.


Croude oilCrude oil daily chart already completed head &shoulders pattern, also break nick line and trend line . today,s price now 50.83 previous Dynamic resistance 50.43 also break and confirm market going more up. In my view Crude oil continuing up trend till Fibonacci 127-141 level And price touch 54.00 aria.. we also find here crude oil daily candle are create harmonic and also completed A-B for cypher patter now price going for C.


US CRUDE OIL - H4 - LONGS IN PLAYUs crude oil - H4 timeframe. I see a pull back move in play on the weekly timeframe with targets of 52.60. On the H4 chart, I have identified a break-out pattern with a demand zone holding. Target is 52.50 and stops at 50, risk to reward 1:5


Crude oil - Longs Daily US crude oil longs in play - In my view, the weekly bearish trend is broken and the daily trend is now in a bullish structure. I see oil reaching 50s before stopping for another pull back then rallying again to 52s.
Crude Oil - 15M View with Elliot WavePossibly a flat day on Monday as Crude goes through wave 4 of wave 1 down. Possible retrace to 4772 (.236 of wave 3) or 4801 (.382 of wave 3) before down to 4648 or 4678 (2.618 of wave 4 depending on where that wave completes).

Crude Oil - UpdateUpdate to previous 12345 waves down chart with a bit more detail. Wave 2 complete (4559 to 4941), wave 1 of 3 underway possibly.

