Crude Oil Cycle AnalysisThis is part 3 on crude oil. In this video, I go over the daily cycles and some statistics for the month of November.
Let me know your thoughts on what you see playing out in November for crude oil.
Crudeoilwti

USOil | New perspective for the week | Follow-up detailIt is fact that WTI crude oil gained about 10% in October following the OPEC+ decision to cut oil production but it doesn't appear that decision is making a significant impact as the price is unable to break out of the $93.50 area in the last couple of weeks. From a technical standpoint, price action is caught within a consolidation phase between the $93.50 and $86.00 zone to emphasize the indecision in the market as we head into the new week. So, a piece of caution is needed at this juncture in the market as anything could happen here.
Disclaimer:
Margin trading in the foreign exchange market (including commodity trading, CFDs, stocks, etc.) has a high risk and is not suitable for all investors. The content of this speculation (including all data) is organized and published by me for the sole purpose of education and assistance in making independent investment decisions. All information herein is for your reference only and I take no responsibility.
You are hereby advised to carefully consider your investment experience, financial situation, investment objective, risk tolerance level, and consult your independent financial adviser as to the suitability of your situation prior to making any investment.
I do not guarantee its accuracy and is not liable for any loss or damage which may result directly or indirectly from such content or the receipt of any instruction or notification therewith.
Past performance is not necessarily indicative of future results.

USOil | New perspective for the week | Follow-up detailWe have been on a profit spree since taking advantage of the breakout of the most anticipated key level at the $86.00 zone.
On Friday, we witnessed a 5% rally in the price of oil, and this is not unconnected to China's decision to ease the COVID-Zero policy and the market overreacted accordingly. Remember, China is the largest importer of Oil hence the ability to drive volatility. From a technical standpoint, as the price edges towards the $93.50 level, I am of the opinion that we wait and see how the price reacts to this level before either making a decision of adding to the existing buy position or hedh=ging out of the position.
Risk Disclaimer:
Margin trading in the foreign exchange market (including commodity trading, CFDs, stocks etc.) has a high risk and is not suitable for all investors. The content of this speculation (including all data) is organized and published by me for the sole purpose of education and assistance in making independent investment decisions. All information herein is for your reference only and I take no responsibility.
You are hereby advised to carefully consider your investment experience, financial situation, investment objective, risk tolerance level, and consult your independent financial adviser as to the suitability of your situation prior to making any investment.
I do not guarantee its accuracy and is not liable for any loss or damage which may result directly or indirectly from such content or the receipt of any instruction or notification therewith.
Past performance is not necessarily indicative of future results.

Crude Oil Swing TradeThe idea here is about Crude Oil Swing Trade:
I am bullish on short term for crude oil due to the below observed technical factors.
1. Support established on a daily chart at the point of falling wedge as per below:
2. Deep Crab Harmonic pattern completed on a daily chart as per below:
3. Leonardo Harmonic pattern completed on a weekly chart as per below:
4. Trading below 20 & 200 EMA on daily chart & weekly chart.
5. RSI is at 34.67 on a Daily Chart & 34.36 on a weekly chart at the time of publishing.
6. MACD below signal line on daily & weekly chart .
Projected targets as per Deep Crab & Leonardo Harmonic provided in the chart & Weekly Image attached as above.
Stop Loss: provided in chart.
Disclaimer: “The above is an Educational idea only and not any kind of financial or investment advice. So please do your own DD (Due Diligence) before any kind of investment”.
Do you like my TA & ideas!!
Want to keep yourself updated with current market action? Then don’t forget boost & to subscribe for more analysis. Do leave your valuable feedback & comments for any improvisations.
Cheers.

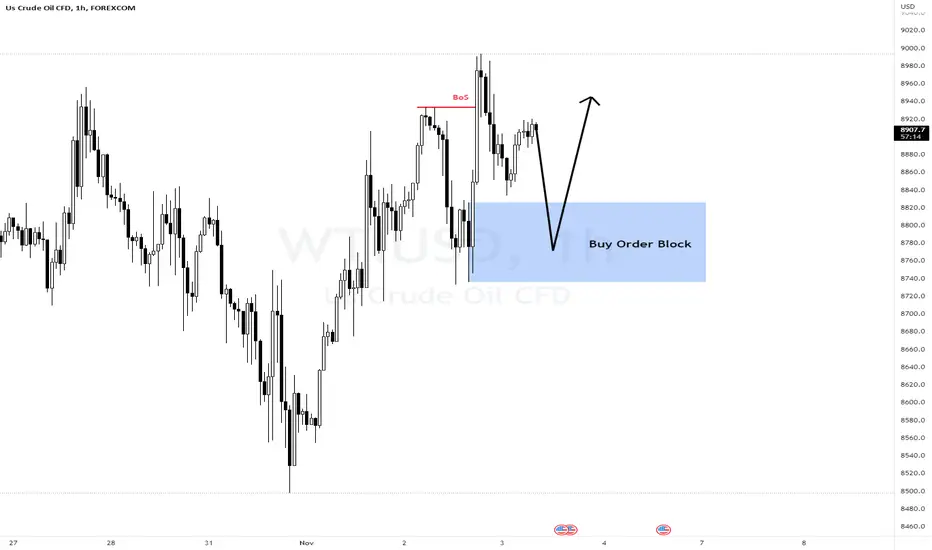
Crude Oil Idea H1Here is my view for WTIUSD on H1. The price could go up, you can put a pending order on the Order block or find an entry on LTF within OB Zone. Trade Safe!
CRUDE OIL intraday trading & back to the home ⬇︎ 02 NOV 2022CRUDE OIL intraday trading alert
3 steps must fulfill before entry
1. 1st breakout done
2. Retracement done
3. 2nd breakout and see you in the home ⬇︎
More info in my profile..
Good luck traders..

CRUDE OIL intraday trading & back to the home ⬇︎ 01 NOV 2022CRUDE OIL intraday trading alert
3 steps must fulfill before entry
1. 1st breakout done
2. Retracement done
3. 2nd breakout and see you in the home ⬇︎
More info in my profile..
Good luck traders..

WTI oil - The downtrend is not done with the oil market Previously, we stated that we wanted to avoid setting a price target for the short-term and medium-term because of high volatility and rumors (then actions) affecting OPEC's supply. Instead, we said that we would focus on our long-term price target of 70 USD. Since then, the price of WTI oil had fallen approximately 4% before erasing some losses.
Today, we are still committed to our long-term price target and expect volatility in the oil market to stay persistent, with the U.S. and OPEC attempting to reach their own economic and geopolitical interests. In addition to that, we are growing even more pessimistic on the topic of demand because of several reasons.
First, the stock market has been in a bear market for the past few months, dramatically raising prospects of lower oil demand over the coming months (especially as the FED will continue to tighten and worsen economic conditions). Second, the OPEC recently confirmed this same narrative about the declining demand when it slashed its demand growth forecast for 2023 from 2.6 million bpd to 2.3 million bpd. Third, a likelihood of more strategic petroleum reserves being released by the U.S. to dampen the price.
Besides that, our views are also supported by technical factors, pointing to liquidity issues in the overall market. We believe this tremendously increases the odds of a stock market crash. As if it was not enough, futures oil contracts manifest backwardation. Therefore, we voice a word of caution to investors.
Technical analysis - daily time frame
RSI, Stochastic, and MACD are bearish. DM+ and DM- performed a bearish crossover. Overall, the daily time frame is bearish.
Illustration 1.01
We introduced the setup above yesterday when the price was near its low. Now, we believe that the time is running out quickly for the long trade. Therefore, we would like the price to break below the short-term support to support the bearish thesis in the short-term term.
Technical analysis - weekly time frame
RSI and MACD are bearish. Stochastic is bullish. DM+ and DM- are bearish. Overall, the weekly time frame is bearish.
Please feel free to express your ideas and thoughts in the comment section.
DISCLAIMER: This analysis is not intended to encourage any buying or selling of any particular securities. Furthermore, it should not be a basis for taking any trade action by an individual investor. Therefore, your own due diligence is highly advised before entering a trade.

WTI oil - Rumors about production cuts elevate the priceOver the past few days, rumors about the OPEC production cut started circulating in the market, with some suggesting the cut could be between 1 mil. bpd up to 1.5 mil. bpd. Subsequently, the price of WTI oil rallied above 83 USD.
This development comes in spite of OPEC's inability to reach its own production quotas and might temporarily lift the price of oil. However, at this point, we still remain relatively bearish on oil in the long term, with a price target of 70 USD.
Despite that, we will pay close attention to the rhetoric of OPEC members about future (potential) production cuts. If the cartel proceeds with further cuts on the supply side, then it might force us to abandon our price target. We will update our thoughts soon.
Technical analysis - daily time frame
RSI and Stochastic are bullish. MACD is neutral. DM+ and DM- are bearish. Overall, the daily time frame is bullish.
Illustration 1.01
Illustration 1.01 shows the daily chart of USOIL and simple support/resistance levels.
Technical analysis - weekly time frame
RSI, Stochastic, and MACD are bearish. DM+ and DM- are bearish. Overall, the weekly time frame is bearish.
Please feel free to express your ideas and thoughts in the comment section.
DISCLAIMER: This analysis is not intended to encourage any buying or selling of any particular securities. Furthermore, it should not be a basis for taking any trade action by an individual investor. Therefore, your own due diligence is highly advised before entering a trade.

Brent Crude ⛽️Oil⛽️ Analyze!!!Brent Crude ⛽️ Oil ⛽️ has passed the main wave W by Zigzag structure (5-3-5). Oil could finish Expanding Flat (3-3-5) or Main wave X at 138.03$ . Of course, the War can change my Scenario, but I don't expect Oil to break 177$ .
I expect the Brent Crude Oil to go DOWN at least to the upper line of Descending Channe & Support Zone .
Brent Crude Oil Analyze ( USDBRO ) Timeframe Monthly (Log Scale)
🔴 Resistance Zones 🔴 & 🟢 Support Zone 🟢 that we have in front of Brent Crude ⛽️Oil⛽️ .
🔴 Resistance Zone 🔴: 147$ until 135$
🔴 Resistance Zone 🔴: 178$ until 159$
🟢 Support Zone 🟢: 88.6$ until 83.3$
Do not forget to put Stop loss for your positions (For every position you want to open).
Please follow your strategy , this is just my idea, and I will be glad to see your ideas in this post.
Please do not forget the ✅' like '✅ button 🙏😊 & Share it with your friends; thanks, and Trade safe.

USOIL - Similarities between 2008 and nowLast week, our short-term price target of 80 USD was reached. Because of that, we would like to reiterate that we remain bearish on USOIL. In addition to that, we maintain our long-term price target of 70 USD.
Illustration 1.01
Illustration 1.01 shows the similarity between the oil price pattern in 2008 and now.
Technical analysis - daily time frame
RSI, Stochastic, and MACD are bearish. DM+ and DM- are bearish. Overall, the daily time frame is bearish.
Technical analysis - weekly time frame
RSI, Stochastic, and MACD are bearish. DM+ and DM- are bearish. Overall, the weekly time frame is bearish.
Please feel free to express your ideas and thoughts in the comment section.
DISCLAIMER: This analysis is not intended to encourage any buying or selling of any particular securities. Furthermore, it should not be a basis for taking any trade action by an individual investor. Therefore, your own due diligence is highly advised before entering a trade.

Wticousd More downsideWticousd More downside I m expecting bearish move and .long term sell trend .H4 market break the demand zone and gave the supply zone .so we will sell from supply zone

Elliott wave analysis of Crude Oil WTI Futures As per Elliott wave analysis Crude Oil WTI Futures is in 4th wave, expect it to reverse and go down to $87 area marked in red circle.

CRUDE OIL intraday trading & back to the home ⬇︎ 19 SEP 2022CRUDE OIL intraday trading alert
3 steps must fulfill before entry
1. 1st breakout done
2. Retracement done
3. 2nd breakout and see you in the home ⬇︎
More info in my profile..
Good luck traders..

USOIL / Crude Oil - Bearish Trend is expected this weekUSOIL has tested the resistance and now ready to fall back to 75 to 80 levels.
Fib level tested at 0.382
Heikin Ashi is indicating a down trend
Trade Setup:
Short Oil from Current Price
TP1 80
TP2 75
SL 88
Good Luck to all Oil traders.
I will update the analysis once there is significant price movement.

Crude Oil in 1H time Frame.Hi Everyone,
Please see updated 1H chart
High Probability to test the resistance.
my updated from 4H before
i try to always we will keep you all updated . Please don't forget to like, comment and follow to support us, i really appreciate you support !
Goodluck
i'll help you to have a great trade.
Please using good money management.
dont take any emotional trade.
Note:
Dont risk more than 0.2% on trending market
Dont risk more than 1% on ranging market
Wish good luck for all people.
Please help support me by Clicking like button, and if you like my ideas please follow me and support me. i Relly Appreciate it!
i'll make more and more great analysis if this chanel grows.
on Gold , Oil , Nasdaq, SP500 , and some American, China, Japan, Indonesia stocks.
Best luck for you.
Cheers mate!
Thankyou.

Crude Oil Idea H4Here is my view for WTIUSD on H4. The price could go down, you can put a pending order on the Order block or find an entry on LTF within OB Zone. Trade Safe!

My swing Full Margin Setup on WTI CRUDE OILThis setup taught by my awesome teacher, a legendary trader from Malaysia, Mansor Sapari.
But man, to get this setup, you need to have a very very strong patience. Of course this setup is not my only setup to trade.
In order to get a complete setup:
Must have
-fakeout
-compression
-cap price zone
-support resistance
-supply zone
-resistance become support
-breakout
-double maru candlestick
-divergence on MACD/AO
-some times it goes well if there's a news (fundamental aspect)
Sorry, my english is not very good to explain. But I'll to explain it in video next time.
Please help me to grow my youtube channel, I would like to share and help others in trading. I also need to learn more stuff.
Search & SUBSCRIBE my channel "The Musician Trader"

Crude Oil Idea H1Here is my view for WTIUSD on H1. The price could go up, you can put a pending order on the Order block or find an entry on LTF within OB Zone. Trade Safe!

CRUDE (CL1!) Will Go Up!CL1! broke the falling resistance
Which turned into a local support
And as the pair is retesting the level now
I think there is a high chance
To see a rebound to the upside

USOIL ! dropping to 70$ very bearishUSOIL still holding from the resistance zone. dxy dropping to hard but oil is not bull. Maybe the price
continue to drop lower low

Crude Oil Idea H4Here is my view for WTIUSD/Crude Oil on H4. The price could go down, you can put a pending order on the Order block or find an entry on LTF within OB Zone. Trade Safe!

WTI oil - Oil continues to drift lowerOver the past four months, we repeated that oil prices were peaking and the downside was looming over the oil market. Despite the excess of bullish calls forecasting new ATH for oil prices, we stuck to our bearish bias. Indeed, a few months ago, we set price targets of 100 USD, 95 USD, and 90 USD for USOIL. After hitting the first two price targets, we still remain bearish and maintain a price target of 90 USD for WTI oil. Our views are based upon technical and fundamental factors.
Illustration 1.01
The picture above shows the daily chart of USOIL. Two moving averages, 20-day SMA and 50-day SMA, reflect the downtrend.
Technical analysis - daily time frame
RSI, MACD, Stochastic, DM+, and DM- are all bearish. Overall, the daily time frame is bearish.
Illustration 1.02
The weekly chart of USOIL shows 20-week SMA and 50-week SMA. The 20-week SMA appears to be reversing to the downside, which is bearish.
Technical analysis - weekly time frame
RSI, MACD, Stochastic, DM+, and DM- are all bearish. Overall, the weekly time frame is bearish.
Please feel free to express your ideas and thoughts in the comment section.
DISCLAIMER: This analysis is not intended to encourage any buying or selling of any particular securities. Furthermore, it should not be a basis for taking any trade action by an individual investor. Therefore, your own due diligence is highly advised before entering a trade.
