$CRVIT broke up om BTC pair beautiful.
Same that happend om CRO before it went 200%
Possible 150% move
CRV

CRV (CURVE) reached targetCRV (curve) has moves based on my last analysis and it reached target. you can save profit.
check the link below to see the previous analysis.


CRV about to flip 🚀CRV looks in a perfect stop to flip that resistance area above.
Targets are mentioned in the chart.
initial resistance will be faced around 3.50-3.60 area which won't hold for a long time. Momentum is ready and this is a bullish accumulation pattern.
Invalidation price is below 2.42.
Enjoy!

CRV/USDT Curve looks extremely bullish after the test of previous resistance.
Simplified all crypto TA to supports and resistances to be able to capture the +3x returns for the following weeks

CRV 1Wis it gonna break the resistance and reach $13?
I wait till it breaks out in 1w time frame, and pulls back in 4h time frame.


CRV - CURVE DAO LONG OPPORTUNITY 20211022 Structure BreakoutSig: Blue -> Green
Structure Breakout
DISCLAIMER
This is only a personal opinion and does NOT serve as investing NOR trading advice.
Please make your own decisions and be responsible for your own investing and trading Activities.

#CRV Buy Setup Looking for 40 to 60 Percent move Buy Range at 4.33 or 4.5
Tp1 At 5 Tp2 At 5.5 Tp 3 At 6 tp 4 at 6.5 tp 5 at 7 ✅
Stoploss 🛑 Hold

CRV new ATH before years endCRV will make a small pull back and test $4.59 as support before heading to $5.09. CRV is heading to new ATH. CRV

CRV Curve after formin a bullish penant. Send it to 7$Curve looking strong.
After left the Zone 3,60 - 3,80$ and formin a nice Bull flag; bullish Penant, falling wedge... and break out... we will se a new ATH to 7,15 - 7,72 $
Be careful of a retest...
ReX Trading

CRV: ONE BULLISH LOOKING CRYPTOCRV :
Big base/ kind of cup and handle style pattern.
Broke big resistance.
Came to retest the resistance which is now a suppor t.
Also currently sitting on 50 EMA.
Ready for bullish continuation if 3.75 holds.
Target Fibs and cup n handle around 6.87/6.90
Trade safe!

CRVUSDT Channel formation!CRVUSDT (Day Chart) Technical Analysis Update
CRV/USDT currently trading at $0.4.50
Buy level: Above $4.55
TP 1: $4.98
TP 2: $5.33
TP 3: $5.70
TP 4: $6.00
Stop loss: $3.97
Max Leverage: 2x
Always Keep stoploss


crv/usdt 4H prediction If breakout occurs And the bitcoin do not massacre market, crv has good money in it.

CRVUSDT - Can break out this time?BYBIT:CRVUSDT
4H trend chart
-
CRV is building a big descending wedge since 10/28
It tried to take out this wedge but failed yesterday.
Now it approaches the upper downtrend line again.
If price can break out this downtrend line, trading strategy as below.
-
Profit Targets:
a) 4.887~5.027----Fib(1.272~1.382)
b) 5.328----Fib(1.618)
c) 5.815----Fib(2)
Stop losses:
a) 4.031-----Red horizontal ray
-
If you like this analysis, smash the "like button" and leave a comment below to share your thoughts
or let me know what crypto you want to see!
Trading is a reflection of yourself. Learn more daily and be ready for every opportunity.
Have a nice trading!

$CRV retesting top of previous range after breakout.Simple HTF-trade. Targeting $7-9.
Lose the level on a weekly, and I'll lose interest. Spot play.


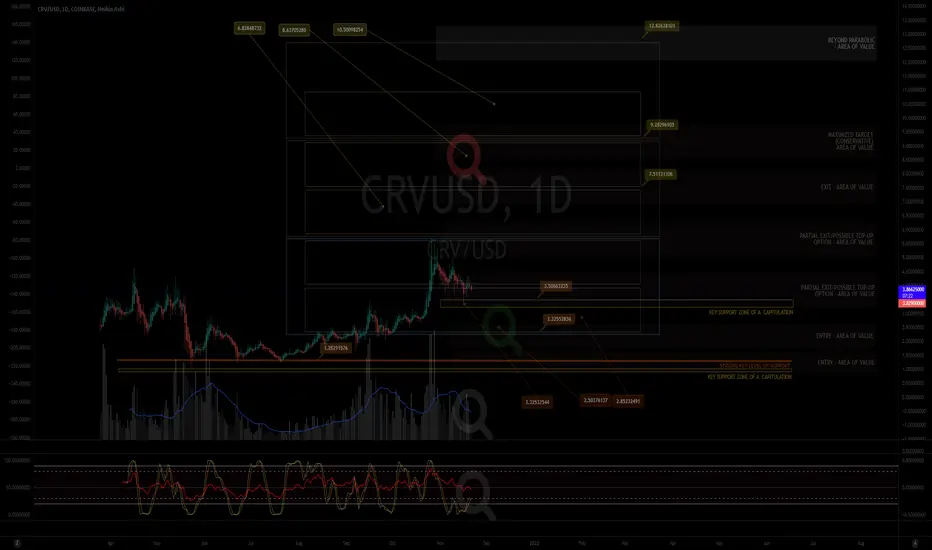
MY MINIMALIST CHART ANALYSIS FOR CURVE ALTCOIN$CRV
11.22.21
0751H +8 PACIFIC
ALERT: ADJUSTED CHART DUE TO BTC's CORRECTION
TOP-UP AREA OF VALUE HAS MOVED DOWN, THIS WILL BE A GOOD BUY FOR US
Disclaimer:
The findings of the following analysis are the sole opinions of the publisher of this idea and should not be taken as a piece of investment advice.
The Market has amazingly moved along the TOPS and BOTTOMS of our BOXES, signifying TURNING POINTS of PRICE ACTION.
JUST DYOR ENTRIES. Watch for Price action/ RSI and STOCH, VOLUME, and FIBS. Set your tight stop loss as any geopolitical, natural/man-made calamities will change the course for our TARGET AREAS OF VALUES.
REMINDER: "FOLLOW THE WHITE RABBIT!"
HOW TO USE THIS MINIMALIST CHART (You can CLICK AND hold THE CHART and PAN or DRAG IT.)
INDICATED ARE ENTRIES, PARTIAL EXITS/TOP-UPS, EXITS, and MAXIMIZED AREAS OF VALUE
Just Follow the TOPS and BOTTOMS of the BOXES as a GUIDE where the MARKET will take you.
Created on a MONTHLY, WEEKLY & DAILY Analysis (The Dynamics of the Market.)
It is designed for SWING TRADES at the BOTTOM. I do not SHORT, though, you can still use it.
TARGET ZONE IDENTIFICATION
The LARGE BOXES (Tops and Bottoms) are MAJOR pivot points that will occur sometime in the future. While the SMALL BOXES (Tops and Bottoms) are MINOR pivot points.
These can be entries to a BUY/ SELL POSITION, EXIT/PARTIAL EXIT/TOP-UP AREAS,
and, if you wish to hold longer for a MAXIMUM TARGET EXIT AREA OF VALUE - CONSERVATIVE (If price action conditions are right at that given moment.)
At times I include WAY BEYOND PARABOLIC Price TARGETS depending on The Character of the Market (CRYPTOS ONLY).
Watch out for your Volume, Chart Patterns, Candlestick Math, FIB COILS, Price Action, FIB LEVELS, Market Dynamics, especially institutional and retailer trading psychology.
Wishing you all The Best Trades and Thank you all for your Appreciation and Support of My Work.
Much thanks to My 3 Mentors. They are so much of a Blessing that I also wish to Share.
Vive Le Autist!
Vive Le Egalitarianism!
crvusdtHi . This currency is in the uptrend channel and is in the blue range suitable for buying.
Loss limit: $ 2.5
Profit limit: $ 5 - $ 8

CURVE(CRV) RESULTCurve(crv) just moved based on my last analysis.
check the link below to see the previous analysis,

CRVUSDTHello Crypto Lovers,
Mars Signals team wishes you high profits.
We are in a daily time frame.
Price is fluctuating within a flag pattern. If it can move above the resistance line and stabilize, it can experience a good climb.
We wait for the price to fluctuate above the resistance line and then enter the trade to achieve higher targets.
Warning: This is just a suggestion and we do not guarantee profits. We advise you analyze the chart before opening any position.
Wish you luck
