Curve DAO CRV price analysis🤑 Did it really happen?) CRYPTOCAP:CRV price has finally “really” come out of the 3-year down trend. A confident breakout, on high volumes, "just like a book says".
💰 Now OKX:CRVUSDT price has hit the mirror level, so we can assume that the correction may be delayed to gain strength to break higher.
A correction in the range of $0.43-0.67 fits into the canons of wave analysis and will not break the structure and growth trend.
And the global 5th wave of growth #Curve DAO token can be expected at least to $4.10-5.50
_____________________
Did you like our analysis? Leave a comment, like, and follow to get more
CRV

CRV Pullback for 300%??Analysis using SNR ORIGINAL chart Pattern, trade at ur own risk, u may TP at goodseller for scalping.

TradeCityPro | CRV: Navigating Curve's DEX Dynamics👋 Welcome to TradeCityPro!
Today, I'll analyze the cryptocurrency CRV from the Curve project, a decentralized exchange (DEX).
📅 Weekly Timeframe
We observe a trading range from $0.3903 to $1.2502. The price once dipped below this range to $0.2237 before rebounding, and it has now reached the upper boundary again.
🔍 Breaking the resistance at $1.2502 could signify an exit from the accumulation zone, potentially propelling the price toward higher resistances. The key weekly resistance is $6.1038, which is the all-time high, but intermediate resistances exist at $1.8428 and $2.8814.
📊 The market volume became bearish after reaching $1.2502, aligning with a market correction. The RSI has reset from the overbought region, ready to display new momentum as the market structure evolves.
🔽 If selling pressure enters the market and the price breaks below the $0.3903 support, it might suggest the previous uptrend was merely a dead cat bounce, preparing for a drop to new lows.
📅 Daily Timeframe
More details of the bullish run can be observed here. As mentioned, the price has reached up to the $1.2502 resistance and has entered a corrective phase.
✨ The correction established a floor at $0.7942, coinciding with the 0.236 Fibonacci level, though this support has now been breached. The price is forming a descending trendline, moving toward lower support levels.
🧩 The first minor support is the 0.382 Fibonacci level, not strongly backed by static price supports. The main supports are at $0.4970 and $0.3490.
📉In my view, breaking below $0.4970 would necessitate a new upward structure aiming back towards the range's ceiling. Conversely, a break below $0.3490 would end the bullish trend completely. A break below $0.2237 would initiate a bearish phase in the High Wave Cycle. Breaking below 30 on the RSI would further confirm the bearish trend.
🔼 If the price rebounds above $0.7942 and negates the current downward trend, we could consider a long position following a break of the descending trendline. The target would be modest, aimed at the top of the current box. The critical trigger for a long position remains the breach of $1.2502, a strong indicator for the start of a new bullish leg.
📝 Final Thoughts
This analysis reflects our opinions and is not financial advice.
Share your thoughts in the comments, and don’t forget to share this analysis with your friends! ❤️

CRV LONG After experiencing a parabolic increase from 0.221 to 1.328, the price has oscillated within a descending trend, forming progressively lower highs. I believe there is still an opportunity to position long when the price revisits the demand zone, which aligns with the 61.8% Fibonacci retracement level and the 2024 annual opening price slightly below it. However, if the price breaks below this demand zone, another opportunity may arise around the 0.25 level, where we also have an nPOC (naked Point of Control).

Curve (crv)Crv usdt Daily analysis
Time frame 2hours
Risk rewards ratio >2.3 👌👈
Technical analysis
CRV is caught in a triangle. In similar cases, the price breaks out from the bottom or top of the triangle.And we'll have to wait and see where it comes from.
But why is my analysis a bullish one?
This bullish analysis is solely for the purpose of examining market sentiment.
Given the positive news we hear in the cryptocurrency market and the positive sentiment of buyers in this market, we come to this bullish analysis.
Risk rewards ratio is another good point for this analysis
Ratio 2.3 makes me a brave heart analyzer.
Only by introducing a false selling pressure can this analysis be failed. So , I put my LS in correct place. Of course I know the power of stop hunters.


CRVUSDT - keep an eye on itCRV one on the most bullish coins in every bullish wave.
Daily chart shows a consolidation of symmetrical triangle pattern.
It gives positive sign as it breaks 0.5 fib , 50ema ... But still need more confirmation for being bullish
Valid to buy now
Ur target is 2$ at least in case of breakout the symmetrical triangle pattern
Best regards Ceciliones 🎯

$CRV Daily Bottom confirmedPretty simple stuff here. Deviation into manipulation zone and printing a B/R reversal signal with each consecutive day closing above the upper wick. Do not need to over think this here.

Keep eyes on CRV! So after breaking a bullflag pattern and hitting 2 take profits I am looking for another Long-term entry before BINANCE:CRVUSDT goes to the moon. What I like to see is hitting 0.70 area and hold above it. 0.70 is minor support which is active in 1D timeframe. I would love to see hit 0.50 area too. Either way I will enter long position.

CRV LongAs we analyze the CRV/USDT pair, we observe two possible scenarios for price movement in the coming days.
Bullish Scenario (Red Path):
Price breaks above the current resistance levels, moving towards the PMH (Previous Monthly High). This scenario indicates a strong upward rally, aiming to reach our conservative target in the near term. Watch for confirmation of buying pressure in the short-term to validate this path.
Bullish Scenario 2 (Black Path):
Price may fail to break the current resistance, resulting in a pullback towards the PML (Previous Market Low), which could act as support. If the price fails to maintain above this level, further downside is possible, but it might provide an opportunity for a bounce in the future.
Ensure to monitor the key price levels (current support and resistance) for a clear confirmation of the chosen path.
Happy trading!

CRV is looking good for a short term dip and runCRV is looking good for a short term dip in alignment with BTC price action. I will be accumulating CRV on dips as the HTF charts point to larger price appreciation potential.
My first target after the dip is 1.42 and 2.81 and my banana zone target is $10.

buy positionHello guys
This currency has managed to break its resistance due to its good growth.
Now, when the Pullback moves, it goes under the Pullback with a stop loss and enters a long position.
Capital management should be observed.
This analysis is only reviewed from a technical point of view.
Be successful and profitable.

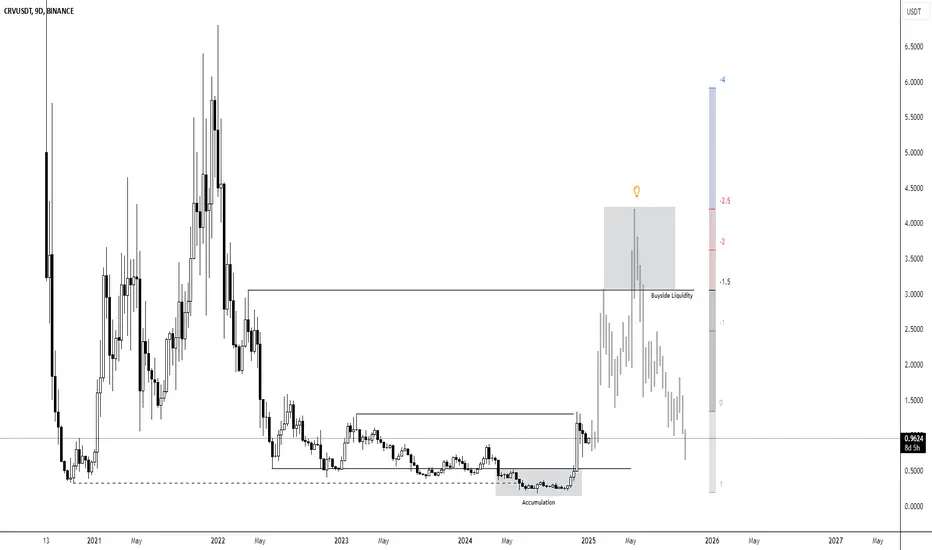
CRV LongThis chart displays the price movement of CRV/USDT on a 9-day candlestick chart.
The chart illustrates a significant accumulation phase followed by a sharp price rise, with an emphasis on the liquidity levels at key points.
The initial drop in price leads into a period of consolidation, marked by an "Accumulation" phase.
After the accumulation phase, we observe a surge in price, targeting the "Buyside Liquidity" area.
The price is currently at a lower level, indicating potential opportunities or challenges in the price movement based on liquidity zones.
The liquidity zones, particularly the "Buyside Liquidity" marked on the chart, could play an important role in price dynamics moving forward.
The chart suggests that future price movements may depend heavily on the dynamics of the liquidity zones and the market's ability to maintain higher price levels after the recent surge.
TradeCityPro | CRV: Daily & 4H Correction Patterns👋 Welcome to TradeCityPro!
In this analysis, I will examine the CRV coin, which belongs to the Curve project, a DEX platform in the DeFi space. The analysis is conducted on both daily and 4-hour timeframes.
📅 Daily Timeframe: Beginning of Correction In this timeframe, after negative news for CRV, the price reached the support level at $0.2309, forming its main bottom there and starting its upward movement after accumulating.
📊 With the influx of buying volume, resistances at $0.3425 and $0.4070 were easily broken, and the price reached the resistance at $1.2630 with high momentum. The buying volume peaked and, with a Blowoff candle, the price correction began.
✨ The RSI exiting the Overbuy zone triggered the start of the price correction down to $0.382. Currently, the bottom of the correction is forming at $0.7890, and breaking this area could reach the $0.5 and $0.618 Fibonacci levels, which I have marked as limited areas for you. If these areas break, the next supports will be at $0.4070 and $0.3425.
🔍 If the price wants to continue in the same cycle with the next upward wave, it should not lose the range between $0.5 to $0.618 Fibonacci. Breaking this range would reset the market momentum, and the chart would need to create a new structure.
📈 For going long, the best trigger is breaking $1.2630 targeting $1.9116. If this area breaks, the volume and RSI should converge with the price. A divergence in volume greatly increases the likelihood of a fake break. For riskier triggers, it's better to look into the 4-hour timeframe.
⏳ 4-Hour Timeframe: New Price Structure in the Correction Phase
In the 4-hour timeframe, we can see the last upward leg in more detail and apply a new Fibonacci Retracement.
🧩 Currently, the price has corrected to the $0.5 Fibonacci zone, which overlaps with $0.7890, forming the primary bottom of the correction.
🔼 For an early and risky long position, breaking the resistance at $1.0451 is suitable. However, as mentioned in the daily timeframe analysis, the main resistance and trigger for going long is $1.2630.
🔽 For a short position, breaking the $0.382 Fibonacci, which overlaps with $0.9069, is suitable, but be cautious as you are shorting in a correction of an upward trend. Engage minimal risk so that if the upward trend continues, you do not incur significant losses.
🔑 The market volume has been decreasing since the peak at $1.2630 and is now at its lowest. The RSI is also ranging between 39.82 to 59.27, with a break of either area potentially introducing new momentum into the market.
📉 If further correction occurs, the next supports are the $0.618 Fibonacci at $0.69, and the areas at $0.5553 and $0.4661.
📝 Final Thoughts
This analysis reflects our opinions and is not financial advice.
Share your thoughts in the comments, and don’t forget to share this analysis with your friends! ❤️

CRV Long- It has hit our HTF Sellside Liquidity Target and an all time low.
- Market is in fear mode right now
- Bitcoin dumping
- CRV Stops have been ran.
- We are trading below the Monthly opening which is great for buying if we are bullish

The One Thing Everyone's Missing About CRVUSDT - Curve◳◱ On the BINANCE:CRVUSDT chart, the Bband Breakout pattern suggests an upcoming trend shift. Traders might observe resistance around 1.4705 | 1.7378 | 2.4061 and support near 0.8022 | 0.4012. Entering trades at 1.2631 could be strategic, aiming for the next resistance level.
◰◲ General Information :
▣ Name: Curve
▣ Rank: 99
▣ Exchanges: Binance, Kucoin, Huobipro, Gateio, Mexc, Hitbtc
▣ Category / Sector: Financial - Decentralized Exchanges
▣ Overview: Curve Finance is a decentralized exchange optimized for low slippage swaps between stablecoins or similar assets that peg to the same value (e.g. wBTC/renBTC). The protocol employs a Automated Market Maker that was built specifically to give DeFi users low slippage and liquidity providers steady fee revenue.
◰◲ Technical Metrics :
▣ Current Price: 1.2631 ₮
▣ 24H Volume: 138,006,035.406 ₮
▣ 24H Change: 6.943%
▣ Weekly Change: 4.76%%
▣ Monthly Change: 327.13%%
▣ Quarterly Change: 351.68%%
◲◰ Pivot Points :
▣ Resistance Level: 1.4705 | 1.7378 | 2.4061
▣ Support Level: 0.8022 | 0.4012
◱◳ Indicator Recommendations :
▣ Oscillators: NEUTRAL
▣ Moving Averages: STRONG_BUY
◰◲ Summary of Technical Indicators : BUY
◲◰ Sharpe Ratios :
▣ Last 30 Days: 9.88
▣ Last 90 Days: 4.84
▣ Last Year: 1.00
▣ Last 3 Years: 0.20
◲◰ Volatility Analysis :
▣ Last 30 Days: 1.89
▣ Last 90 Days: 1.32
▣ Last Year: 1.11
▣ Last 3 Years: 1.12
◳◰ Market Sentiment :
▣ News Sentiment: N/A
▣ Twitter Sentiment: N/A
▣ Reddit Sentiment: N/A
▣ In-depth BINANCE:CRVUSDT analysis available at TradingView TA Page
▣ Your thoughts matter! What do you think of this analysis? Share your insights in the comments below. Your like, follow, and support are greatly valued and help sustain high-quality content.
◲ Disclaimer : Disclaimer
The content provided is for informational purposes only and does not constitute financial, investment, or trading advice. Always conduct your own research and consult a qualified professional before making any financial decisions. Use of the information is solely at your own risk.
▣ Explore the Power of Charting with TradingView
Unlock a wide range of financial analysis tools, data, and features to elevate your trading experience. Take a tour and see the possibilities. If you decide to upgrade your plan, you can receive up to $30 back. Discover more here - affiliate link -

CRV built a burj khaifa on its goldencrossCRV easily could just keep going parabolically vertical here but this would also be a very nice place to catch its breath and attempt to complete the right shoulder to an inv h&s pattern. Just in case I will be watching this trendline to see if it can break above it in the next few candles or not *not financial advice*

Curve DAO (CRV)Curve Finance is an Automated Market Maker based Decentralized Exchange (DEX) that focuses on allowing users to swap between assets that have very similar underlying value at the lowest slippage.
Anyway, it seems CRV is oscillating in a wide sideways channel. Currently, CRV is at the bottom of this channel, a good place for both spot and future traders to consider. Let's see what happens.


CRVUSDT Potential Long Term Accumulation-DistributionIn this analysis, we focus on a long-term accumulation strategy for CRVUSDT.
Accumulation Zones:
$0.4720: Identified as an accumulation entry point for 10-20% of your position. Potential price movement of approximately 10-15%.
$0.4300: Stronger accumulation zone for an additional 5-10%. Potential price movement of 20-25%.
$0.3750-0.3300: Critical demand zone, optimal for accumulating 10-20% of the position. Potential price movement of 35-45%.
Distribution Zones:
$0.7000: First major distribution zone for partial distribution of accumulated assets (1-5%). Potential price movement of 50%.
$1.1410: Next distribution zone for further distribution (5-10%). Potential price movement of 145%.
$2.0974: Higher distribution zone, ideal for 10-20% distribution. Potential price movement of 305%.
Volume Analysis: Increased volume at support levels indicates strong buying interest and validates accumulation zones.
Current market sentiment shows a mix of consolidation with potential bullish reversal signals, supported by the harmonic pattern and volume spikes at lower levels.
This long-term accumulation strategy for CRVUSDT focuses on systematically entering positions at identified accumulation zones and distributing at key distribution zones. This methodical approach aims to capitalize on both the technical patterns and market sentiment, ensuring a balanced risk-reward ratio.
Additional Details about Curve DAO Token (CRV):
Market Cap: Approximately $400 million
Fundamentals: Curve DAO Token is a decentralized exchange optimized for stablecoin trading. It provides low slippage and low fee swaps between stablecoins, making it an essential component of the DeFi ecosystem.
Potential: Increasing adoption of DeFi and the need for efficient stablecoin trading solutions.


CRV deviation before major breakout ?CRV / USDT
Price broke down its historical major support to reach new all time low after bad news recently
At this point its either accumulation or distribution …I think more its accumulation… the buying here could be an opportunity but also has a potential risk for continuation of downtrend
However, if the price can reclaim the major support again it will become less risky with more confirmation for uptrend
Best of wishes

#CRV/USDT#CRV
The price is moving in a descending channel on the 12-hour frame and is sticking to it very well and is expected to break it upwards
We have a bounce from a major support area in green at 0.5250
We have an uptrend on the RSI indicator that was broken upwards which supports the rise
We have a trend to stabilize above the 100 moving average which supports the rise
Entry price 0.3000
First target 0.4000
Second target 0.5071
Third target 0.5071
