CRV

CRV/USDTHuge Cup & handle pattern on weekly time frame , coinbase just announced they will list CRV on Thursday , I expect to hit the target in coming days.


Very Bullish Pennant on $CRV - COINBASE LISTING 3/23Great bullish set up here. we will look for one more candle for confirmation and then its off to the races.
NEWLY LISTED ON COINBASE.


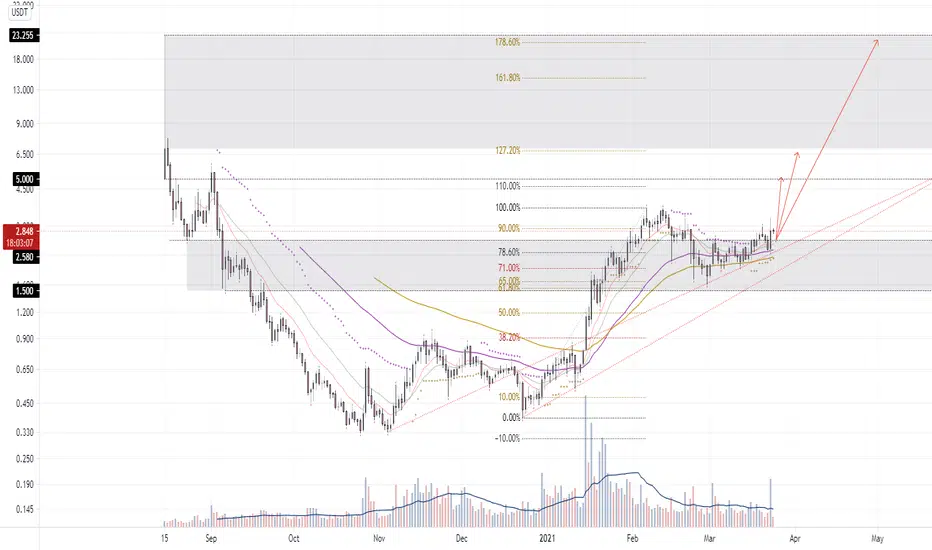
CRVUSD: $6 Soon?!CRVUSD appears to be in the final innings of a cup & handle pattern formation, which suggests that CRVUSD could move to ~$6 in the not so distant future. For this to happen, CRVUSD needs to continue to respect the upward support of the handle and move through $3.50 resistance. That's no small task, but certainly within the realm of possibilities when considering the current trend in the 14-day RSI and how tight the Bollinger bands are getting.
As always, BTC dictates the broader macro trend for the alts. A CRVUSD break out implies that BTCUSD doesn't enter into a downward correction over the next few weeks.

CRV/USDT Long BuyAs you see the price have a pull back to balance line and with the sentiments of market it will toes up. Also there is a support zone in 2.5$ price but i thinks crv can see 3.5$ again and after that we will see what pattern it will make.

CRV pump potentialForming a base and parabola, broke over decending diagonal and restested it (green), and about to break over resistance. In a rising wedge but these rising wedge tend to breakout in a pump and blow off top as in January 11th. Otherwise the rising wedge breaks down to the channel support. Targets outlined by orange boxes.


CRV: Time to break outInside a trinangle in 1W timeframe.
Break to upside leads to a good growth.
Look after this pair.

CRV/USDT - Triangle BreakoutOn the daily char t, the market price broke the triangle with bearish trend line and went up.
After that, a retest of a new support zone was carried out, now the price can continue to move up.
Also, a double bottom formed before the triangle was broken, which confirmed to us that a breakout would be made.
If you like ideas like this, please like and subscribe to this channel so as not to miss another technical analysis .
Write your opinion about it in the comments. I would like to discuss this with anyone.
This is NOT a FINANCIAL ADVICE . This is just my point of view on the current situation.

CRV looking bullishBullflag has broken up!
See you at around 4.2$!
Please hit LIKE if you find this useful!

Curve (CRV): All levels to watch!I made a simple cheatsheet for you, look to levels.
My Bias: Bullish
Basis:
4H MACD: Bullish
4H RSI: Bullish
EMA 12H: Support Price
Volume 1H: Increase
look nice to me, be patient.
BTC: 1Gro97DoABk7BMegn5TKopmMXLKQefej9r
XRP: rw7wnYPy8ZR542piPUNcz8fzmkNZY27WXS
BNB: bnb1r2r3rzad7v0lkmhr4kn6wp5stsr7ur8gknvqp2
UNI: 0x112F395E94a7084Ca6dAa9Ba1462192Ac56570F5
USDT: 0x112F395E94a7084Ca6dAa9Ba1462192Ac56570F5

CRV/USDT Binance4H hollow candles.
An asymmetric triangle has formed, so a price breakout is expected.
Curve DAO Token Price (CRV) = $2.41 +10.47%
0.00004362 BTC12.53%
0.001353 ETH9.74%
Good Luck
Cryptohellas Team

$CRV - Undervalued Assets Tend to go Up Confirmed breakout above $2.6 and it will roughly 10x
12th crypto for Fees generated
M.Cap / TVL = 0.13
It's on the cheap side

Do it🔥Traders are most motivated workers, wolves🔥
There is a great trade opportunity for you.
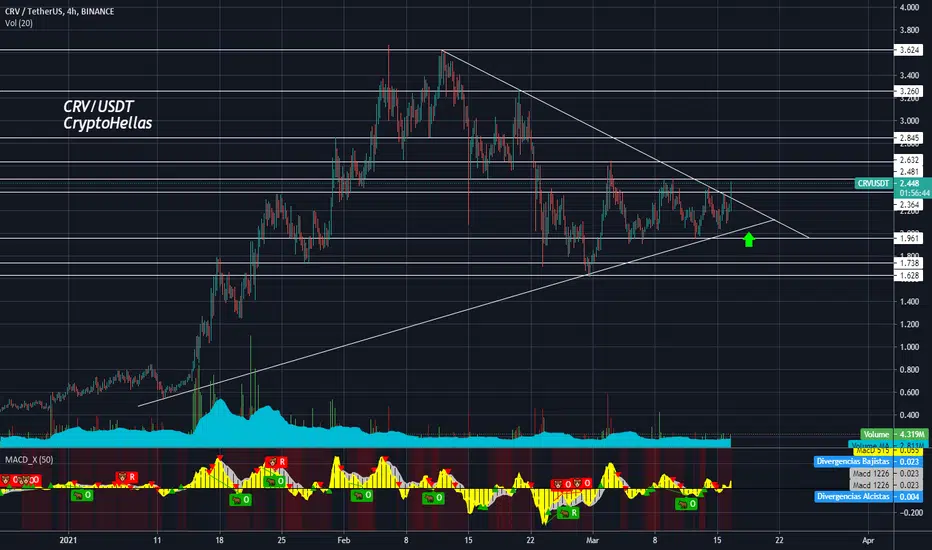
Symmetrical triangle on CRVUSDT.
Previous bearish trend was broken, so it may be a good signal for bulls to wake up.
According to Elliott Waves theory all the waves are done and the price is heading to the breakout.
Follow the chart and look for the breakout carefully.
_____________________________________________________
If you enjoy my FREE Technical Analysis , support the idea with a big LIKE👍 and don't forget to SUBSCRIBE my channel, you won't miss anything!
Feel free to leave comments✉️
And always remember: "we don't predict, we react".


CRVUSDT (CRV) - POTENTIAL BREAKOUT ANALYSIS 🔎
- CRVUSDT is resisted by the descending trendline resistance (DTR).
- Price is testing the descending trendline resistance (DTR).
- Price action is printing a symmetrical triangle (ST) pattern at the test zone.
- There's a breakout potential.
BUY ENTRY ⬆️
- Breakout above the descending trendline resistance and the symmetrical triangle's inclined resistance.
TARGETS 🎯
- Horizontal resistance level (R1).
- Horizontal resistance level (R2).
SETUP INVALIDATION ❌
- Breakdown below symmetrical triangle's inclined support.


CRVUSDT - Price still inside a triangleEverything is marked on chart!
Please like and share.
Thank you.
