Potential Breakthrough Ahead with RSI MomentumThe CRV (Curve DAO Token) has recently rebounded from the established daily support range of $0.756 - $0.79. With the local resistance zone located between $0.92 - $0.93, there is a possibility of a price movement towards this area. It is recommended to exercise patience and await a test of the support zone before considering new entry positions. Additionally, the Relative Strength Index (RSI) level currently stands at 58, indicating moderate strength and momentum in the CRV's price. This suggests a balanced market sentiment with potential for further upward movement. However, it is important to closely monitor price action and consider other relevant factors before making any trading decisions.
CRV

CRV longCRV bounced off the ascending trendline and bounced off the support level. Bullish movement to resistance level at 0.88 is expected to happen.

CRV is going to PUMP and I like itCrv holding support on the 2hr chart, taking profit at the resistance levels. 0.91 should satisfy me
Find order and Chaos will follow.


CRV/BTC - Curve: BBand_Breakout Super-Trend◳◱ A Bollinger Band breakout and a Super Trend pattern have been noticed on the LSE:CRV / CRYPTOCAP:BTC chart, indicating a bullish trend. The Bollinger Band shows a probable positive trend as the price has moved outside of the upper band, while the Super Trend confirms the bullish trend. To buy at the current price range and aim for higher levels would be a solid option. The key resistance levels are located at 0.00003101 | 0.0000321 | 0.00003407, and the major support zones can be found at 0.00002904 | 0.00002816 | 0.00002619.
◰◲ General info :
▣ Name: Curve
▣ Rank: 64
▣ Exchanges: Binance, Huobipro, Gateio, Bittrex, Kraken, Hitbtc
▣ Category/Sector: Financial - Decentralized Exchanges
▣ Overview: Curve Finance is a decentralized exchange optimized for low slippage swaps between stablecoins or similar assets that peg to the same value (e.g. wBTC/renBTC). The protocol employs a Automated Market Maker that was built specifically to give DeFi users low slippage and liquidity providers steady fee revenue.
◰◲ Technical Metrics :
▣ Mrkt Price: 0.00003077 ₿
▣ 24HVol: 5.694 ₿
▣ 24H Chng: 1.217%
▣ 7-Days Chng: 1.61%
▣ 1-Month Chng: -13.45%
▣ 3-Months Chng: -33.87%
◲◰ Pivot Points - Levels :
◥ Resistance: 0.00003101 | 0.0000321 | 0.00003407
◢ Support: 0.00002904 | 0.00002816 | 0.00002619
◱◳ Indicators recommendation :
▣ Oscillators: NEUTRAL
▣ Moving Averages: STRONG_BUY
◰◲ Technical Indicators Summary : BUY
◲◰ Sharpe Ratios :
▣ Last 30D: -4.58
▣ Last 90D: -1.66
▣ Last 1-Y: 0.24
▣ Last 3-Y: 0.20
◲◰ Volatility :
▣ Last 30D: 0.62
▣ Last 90D: 0.76
▣ Last 1-Y: 1.19
▣ Last 3-Y: 1.81
◳◰ Market Sentiment Index :
▣ News sentiment score is 0.61 - Bullish
▣ Twitter sentiment score is 0.49 - Bearish
▣ Reddit sentiment score is 0.66 - Bullish
▣ In-depth CRVBTC technical analysis on Tradingview TA page
▣ What do you think of this analysis? Share your insights and let's discuss in the comments below. Your like, follow and support would be greatly appreciated!
◲ Disclaimer
Please note that the information and publications provided are for informational purposes only and should not be construed as financial, investment, trading, or any other type of advice or recommendation. We encourage you to conduct your own research and consult with a qualified professional before making any financial decisions. The use of the information provided is solely at your own risk.
▣ Welcome to the home of charting big: TradingView
Benefit from a ton of financial analysis features, instruments and data. Have a look around, and if you do choose to go with an upgraded plan, you'll get up to $30.
Discover it here - affiliate link -

CRV, give it to me straight!If you find this info inspiring/helpful, please consider a boost and follow! Any questions or comments, please leave a comment! Also, check out the links in my signature to get to know me better!
At an important level here, watching for how PA prints from here.
If it bounces, could be some kind of running or expanding correction coming in.
I am anchoring the count based off of an impulse down, due to sharpness, so looking for an impulse to complete the ZZ. It may be some kind of 2xZZ as well, but I have some long entries planned as well if that is the case.
Cheers!

CRVUSDT likely to hit weekly support and bounceThis one is also aiming for weekly support WS1. 0.80-0.81. It has come quite close to it and I believe it wont shy away from it. However, that hit of the price to the weekly support may provide a long opportunity. The target for this long should be 0.854 and if extended 0.883.

an update on CRV's Bullish trendPrice finally managed to break the Pennant .the price can easily reach the target(2.2) .
Previous Analysis
_ _ _ _ _ _ _ _ _ _ _ _ _ _ _ _ _ _ _ _ _ _ _ _ _ _ _ _ _ _ _ _ _
🌍Thank you for seeing idea .
Have a nice day and Good luck.

CRV: Resistance BreakoutTrade setup : Price reached $1.25 resistance and pulled back to 200-day moving average, which could be an attractive swing entry in Uptrend with upside potential back to $1.25. It just broke back above $1.00 resistance level, indicating Uptrend continuation. Note that price made a Higher Low during this recent downswing, which is also a sign of Uptrend.
Trend : Uptrend across all time horizons (Short- Medium- and Long-Term).
Momentum is Bullish ( MACD Line is above MACD Signal Line and RSI is above 55).
Support and Resistance : Nearest Support Zone is $0.75, then $0.50. The nearest Resistance Zone is $1.00, which it broke, then $1.25.

CRV, see you at the high peak soon...CRV weekly chart is conveying a definite ascending price movement -- creating higher lows.
a x10 prospect -- and thats conversavitve (long term goal)
Significant Accumulation and net buying is spotted at the current levels.
SEEDED AT 1.0
TAYOR.

CRV with the setup to flyCRV with high volume, momentum, and perfect structure above all moving avg's on the daily. What else needs to be said?

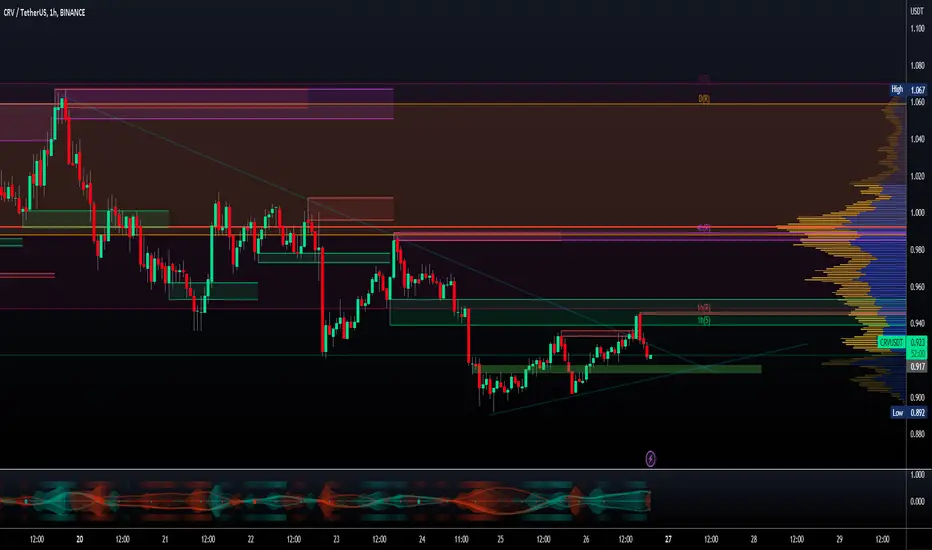
CRVUSDT hit daily resistance, likely to head downThe price hit the daily resistance zone DR and currently trading inside this resistance zone. The probability favors a short here and the target should be the daily support zone DS.

CRV/USDT - Curve: Resistance_Breakout◳◱ A Resistance Breakout has been identified on the $CRV / $USDT chart. The price has broken above a key resistance level, indicating a potential bullish trend. The next resistance key levels are located at 1.103 | 1.187 | 1.392, and the major support zones can be found at 0.898 | 0.777 | 0.572. Consider entering at the current price zone of 0.923 and targeting higher levels.
◰◲ General info :
▣ Name: Curve
▣ Rank: 61
▣ Exchanges: Binance, Kucoin, Bybit, Huobipro, Gateio, Poloniex
▣ Category/Sector: Financial - Decentralized Exchanges
▣ Overview: Curve Finance is a decentralized exchange optimized for low slippage swaps between stablecoins or similar assets that peg to the same value (e.g. wBTC/renBTC). The protocol employs a Automated Market Maker that was built specifically to give DeFi users low slippage and liquidity providers steady fee revenue.
◰◲ Technical Metrics :
▣ Mrkt Price: 0.923 ₮
▣ 24HVol: 5,480,605.876 ₮
▣ 24H Chng: -0.859%
▣ 7-Days Chng: -9.50%
▣ 1-Month Chng: -7.32%
▣ 3-Months Chng: 72.61%
◲◰ Pivot Points - Levels :
◥ Resistance: 1.103 | 1.187 | 1.392
◢ Support: 0.898 | 0.777 | 0.572
◱◳ Indicators recommendation :
▣ Oscillators: NEUTRAL
▣ Moving Averages: STRONG_SELL
◰◲ Technical Indicators Summary : SELL
◲◰ Sharpe Ratios :
▣ Last 30D: -1.81
▣ Last 90D: 2.63
▣ Last 1-Y: -0.09
▣ Last 3-Y: 0.23
◲◰ Volatility :
▣ Last 30D: 0.96
▣ Last 90D: 1.05
▣ Last 1-Y: 1.31
▣ Last 3-Y: 1.85
◳◰ Market Sentiment Index :
▣ News sentiment score is N/A
▣ Twitter sentiment score is 0.49 - Bearish
▣ Reddit sentiment score is 0.71 - Bullish
▣ In-depth CRVUSDT technical analysis on Tradingview TA page
▣ What do you think of this analysis? Share your insights and let's discuss in the comments below. Your like, follow and support would be greatly appreciated!
◲ Disclaimer
Please note that the information and publications provided are for informational purposes only and should not be construed as financial, investment, trading, or any other type of advice or recommendation. We encourage you to conduct your own research and consult with a qualified professional before making any financial decisions. The use of the information provided is solely at your own risk.
▣ Welcome to the home of charting big: TradingView
Benefit from a ton of financial analysis features, instruments and data. Have a look around, and if you do choose to go with an upgraded plan, you'll get up to $30.
Discover it here - affiliate link -
Curve may see Double-Bottom vs BitcoinCurve has primarily been within a parallel downtrend on its logarithmic chart (3 day chart shown here). It broke above that channel and moved nearly a channels width above it, before breaking back down into the same trend. Often when we see a strong channel breakout that eventually falls back into the channel, crypto charts have a tendency to test a breakout on the opposite end. I've drawn channels of equal length above and below to illustrate this.
I'm expecting there is a decent chance this occurs again here, where we break down below the channel and move nearly a channels width below. This would put us in the same range as Curve's ATL vs. Bitcoin, and could stop there or move closer towards the full length of the channel, to have a slightly lower 2nd bottom on its double-bottom.
This is just an idea based on trends I've noticed in crypto. I didn't look for much confluence - but MACD is trending down and volume is still unusually low.
Should this actually happen, expect a strong move back up from the 2nd low or ATL. Short until then, long when it reaches the green box or near lower channel bottom.

CRV is still bullishHi, dear traders. how are you ? Today we have a viewpoint to BUY/LONG the CRV symbol.
For risk management, please don't forget stop loss and capital management
When we reach the first target, save some profit and then change the stop to entry
Comment if you have any questions
Thank You

CRVUSDT to head for next 4h resistance zone around 1.036CRVUSDT is ready to go to the next 4h resistance zone 4HR1. The price is likely to aim at least for 1.036 level.

CRVUSDT heading down to daily support to 0.95 levelCRVUSDT lost the 4h support and now is very likely heading towards the daily support zone DS1. The price has bounced from this zone several times. It shall bounce this time too. How big and how long, that would be a question we shall answer once we see the price hitting this daily support zone.

#CRV moved down!!!!#CRV moved down to a total of 6.3% almost from the breakout level of rising wedge!!!


CRVUSDT(CurveDAOToken) Daily tf Range Updated till 14-02-23CRVUSDT(CurveDAOToken) Daily timeframe range. bellow 0.490# is a price discovery level that comes with concern. but it held back right and retraced back 150%+ which is cool. if it had a little bit more volume could have break 1.284#. clearing that level opens up free space till 1.550#.

crvThe CRV currency is ready for a big jump
Targets $10, $30, and $50
It is a very interesting currency to hold

$CRV/USDT 12h (#BinanceFutures) Ascending triangle on supportCurve just pulled back to 50MA and seems to be preparing for another impulse leading to a bullish breakout.
⚡️⚡️ #CRV/USDT ⚡️⚡️
Exchanges: Binance Futures
Signal Type: Regular (Long)
Leverage: Isolated (2.0X)
Amount: 8.1% (Risk=3%)
Current Price:
1.054
Entry Targets:
1) 1.047
Take-Profit Targets:
1) 1.339
Stop Targets:
1) 0.852
Published By: @Zblaba
Risk/Reward= 1:1.5
Expected Profit= +55.8%
Possible Loss= -37.2%
$CRV #CRVUSDT #Curve #DAO #DeFi

#CRVBTC - A Steady Drop to Meet Multiple SupportstheCrypster -
We've just closed a massive Long trade with #CURVE / #BITCOIN netting a total of over 35%, now we've received a Short signal from CTv2 and we can see a potential for a healthy 10%.
Price should be aiming for a point of multiple support, an ascending trend line meeting simultaneously with a historical level of support, this is our target.
If you enjoyed or agree with this idea - drop us a comment, like & follow! :)
