CRVUSDT 1WCRV ~ 1W Analysis
#CRV This is the lowest support for the moment If you still have a Conviction on this Coin, buy from here with a minimum target of 20%+
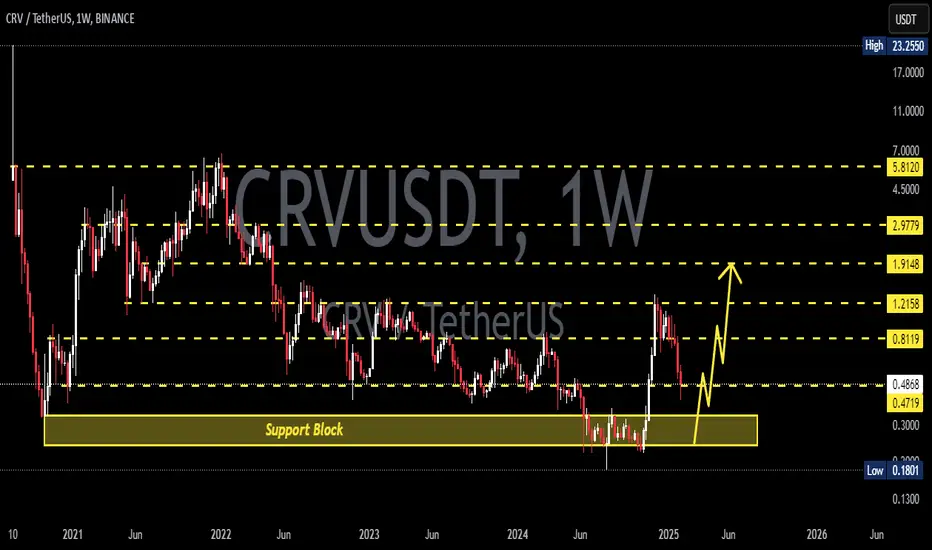
Crvusdbuy
CRV Coin where are you going ?
CRV recently rejected from the strong resistance level of $1.50 - $1.59. Currently, market structure is looking bullish and might take support from the uptrend line. There's also a possibility that price below drop till the strong zone at $1.04 - $1.10. You can Split buy at these levels.

CRVUSDT - Head and Shoulders PatternCRVUSDT (4h Chart) Technical analysis
CRVUSDT (4h Chart) Currently trading at $1.34
Buy level: Above $1.324
Stop loss: Below $1.08
Target 1: $1.46
Target 2: $1.61
Target 3: $1.95
Target 4: $2.4
Max Leverage 2x
Always keep Stop loss
Follow Our Tradingview Account for More Technical Analysis Updates, | Like, Share and Comment Your thoughts

Crv Long setup with 5 R/RHello dear friends...
here is a good Buy position with 5 R/R.
Curve finance is supported by 3D bear base, Ema 50 and Bullish Cup & Handle and Curve trend.
Let's see what is going to happen.

CRVUSDT - Falling Wedge PatternCRVUSDT (1D Chart) Technical analysis
CRVUSDT (4h Chart) Currently trading at $2.12
Buy level: Above $2.23 (Buy after Breakout)
Stop loss: Below $1.80
Target 1: $2.67
Target 2: $3.33
Target 3: $4.60
Target 4: $6.5
Max Leverage 2x / Spot Market
Always keep Stop loss
Follow Our Tradingview Account for More Technical Analysis Updates, | Like, Share and Comment Your thoughts

CRVUSDT 4H BUY SETUPCRV about to breakout from bull flag. Buy here and after breakout its going to fly.
BUY SETUP:
BUY: 4.2-4.295
SELL:
Target 1: 4.4
Target 2: 4.5
Target 3: 4.6
Target 4: 4.7
STOP LOSS: 3.8
Enjoy!!!!!

💡Don't miss the great buy opportunity in CRVUSD". There is a possibility of temporary retracement to the suggested support line (1.788).
. if so, traders can set orders based on Price Action and expect to reach short-term targets."
Technical analysis:
. CRVUSD is in an uptrend, and the continuation of the uptrend is expected.
. The price is above the 21-Day WEMA, which acts as a dynamic support.
. The RSI is at 73.
Take Profits:
TP1= @ 2.041
TP2= @ 2.324
TP3= @ 2.849
TP4= @ 3.522
TP5= @ 4.261
SL= Break below S2
❤️ If you find this helpful and want more FREE forecasts in TradingView
. . . . . Please show your support back,
. . . . . . . . Hit the 👍 LIKE button,
. . . . . . . . . . Drop some feedback below in the comment!
❤️ Your support is very much 🙏 appreciated!❤️
💎 Want us to help you become a better Forex / Crypto trader?
Now, It's your turn!
Be sure to leave a comment; let us know how you see this opportunity and forecast.
Trade well, ❤️
ForecastCity English Support Team ❤️

Catch as much as CRV whenever price dropswe already give it a call on the support with targets n we following up ...
( the call post below this article in the related ideas section)
If u r worried about CRV n not sure that it will go to $7 or even higher ... take a look on the chart
using Fibonacci retracement tool, look how CRV is respecting the support ,, it holds great despite the bloody market these days !!!
our targets still the same don't ever worry .. u will be rewarded soon
good luck 👌

CRV - welcome to summer levels? vol 2It's less than an hour for the daily candle to close and we can see that it has broken the Fibonacci resistance level 1, about $ 3.50.
If in this daily view the apparently bullish movement that we appreciate consolidates, we will consider the new resistance zone between $ 5 and $ 5.50 (mark 1.618 Fib), matching the previous highs back in September of last year.
In the event of a downward correction, the levels to be taken into account are reflected here.
Thanks again


💡CRV: BUY Trade🚀🚀🚀🚀🚀🚀 #ALTSEASON2021📈#CRVUSDT , Fundamental Things are turning bullish on CRV
Once it Breaks Falling Channel, it will pump hard.
➡️Entry: 2.270$
🎯Target 1: 3.200$
🎯Target 2: 3.700$
🎯Target 3: OPEN

CRV - welcome to summer levels?Maintaining the harmonic line that keeps the price action by drawing the fibonacci lines we can deduce some of the following levels to take into account for the next three months.
In a broader daily view we see that the movement is gaining strength, waiting to resolve in the next few days to one side or the other. In both cases here are the levels of support.

CRV breakout of bullflag, Read idea well !CRV / USDT
Price show huge gains last few days and started to correct in flag pattern ..now we can see potenial Breakout of bullflag
Please note that entery now is high risk taking into consideration it already pumped and BTC current situation
If you looking for entery i suggest wait for retest above trendline (best safe approach in current situation) and stoploss will be close again below trendline
🚨This isn't signal its idea and reading chart.. signal is coming with entery and targets and stoploss
Trade at your own risk
Good luck and happy trading

$CRV Putting in an inverse head and shoulder. 5$ target $CRV has been getting accumulated for weeks. We had a clear buy signal on the 12h, with a bull div.
IMO, all dips are for buying and we should be targeting the liquidity at around $5ish (macro perspective). I do not see CRV making a new low unless $BTC drops hard.
We have a short zone sept 28th/29th which should be a little worrisome for longs. Otherwise, she looks healthy!
Once we get above $1.5 resistance, clear sky road ahead!
Patiently waiting to see what other ALTs signal a buy on the daily from our indicator!
Follow, Like & Share! Look at my signature for more updates on our indicators & analysis :)
