Crypto Signal TodayHello friends🙌
Given the buyers' support for the price and their entry, you can buy in steps in the specified areas with capital and risk management and move to the specified targets📈
Follow us for more signals😉
*Trade safely with us*
CRVUSDTPERP
CRV BUY FROM HERECRVUSDT is looking bullish on 1H timeframe. Bullish OB+FVG area filled and green engulfing candle formation is a buy sign,

Fiery support was revealed...Hello friends
According to our technical analysis and research on this currency, we were able to find important supports for you so that you can buy on those supports in stages and with capital management.
The targets are also specified...
*Trade safely with us*

CURVE DAO BREAKOUT - Short EntryLSE:CRV as seen on the 1hr timeframe chart broke downward from the box and has retested the zone. The drop should continue. Trade with caution.
Please support this idea with a LIKE👍 if you find it useful🥳
Happy Trading💰🥳🤗

CRV SWING LONG TRADE IDEACRVUSDT has done bullish BOS after Turning its trend into bullish (CHoCH). Box is a trap where we can see smaller pump but real swing entry zone is in FVG area, keep eye on that.

CRV Breakout Retest – Eyes on the Next Leg UpLSE:CRV has been trading within a well-defined ascending channel, showing a consistent bullish structure. Recently, the price broke above a key horizontal resistance level and is now retesting it—this is a classic breakout-retest scenario.
As long as CRV holds this support and remains within the channel, the bias stays bullish. A successful bounce from this zone could lead to a strong continuation toward the upper boundary of the channel or higher.
DYOR, NFA

#CRV/USDT#CRV
The price is moving within a descending channel on the 1-hour frame, adhering well to it, and is heading for a strong breakout and retest.
We are experiencing a rebound from the lower boundary of the descending channel, which is support at 0.6600.
We are experiencing a downtrend on the RSI indicator, which is about to break and retest, supporting the upward trend.
We are looking for stability above the 100 moving average.
Entry price: 0.6614
First target: 0.6840
Second target: 0.7120
Third target: 0.7420

CRV/USDT : BUY...Hello friends
Due to the good price growth, you can now buy in the specified areas in stages and with capital management and move to the specified goals.
*Trade safely with us*

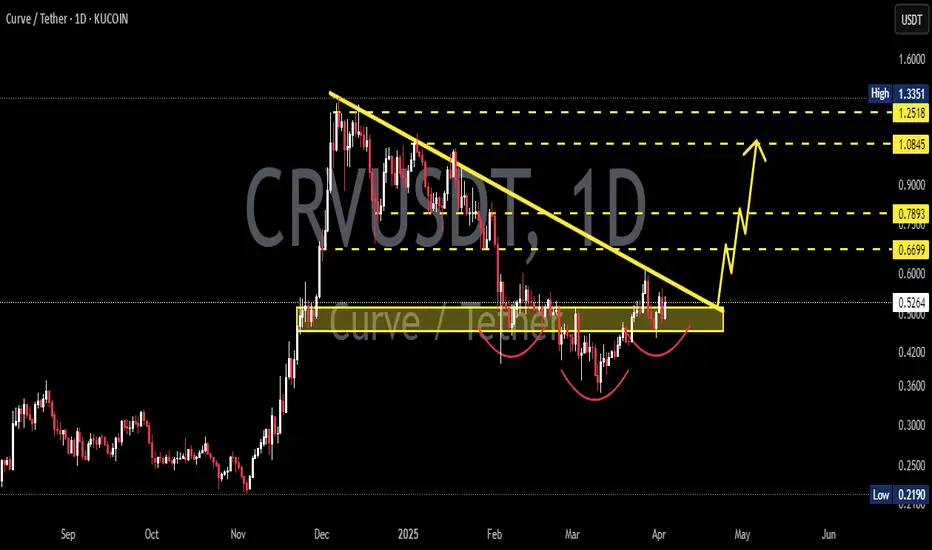
CRVUSDTCRV ~ 1D Analysis
#CRV Buy after successfully penetrating this resistant line with a short -term target of at least 10%+.

CRVUSDT 1DCRV ~ 1D Analysis
#CRV Buy after successfully penetrating this resistant line with a short -term target of at least 10%+.
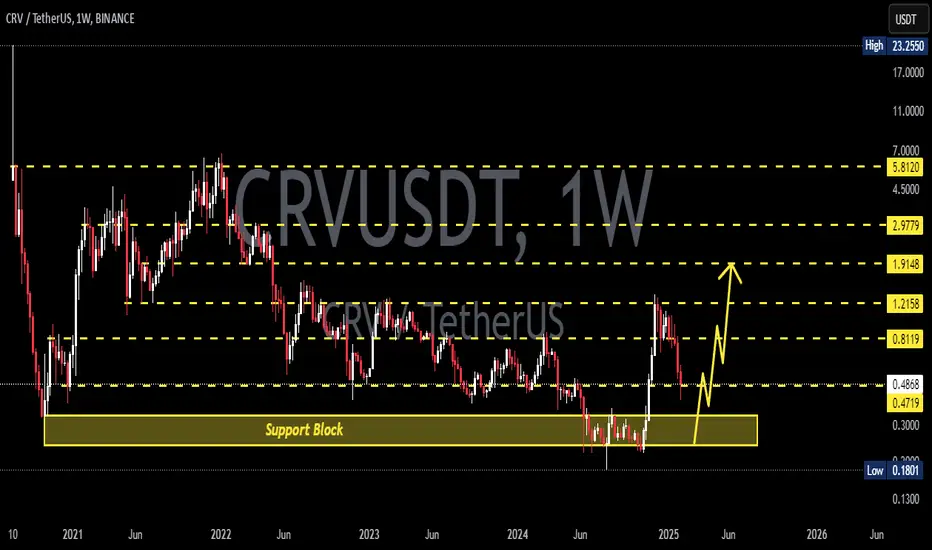
CRVUSDT 1WCRV ~ 1W Analysis
#CRV This is the lowest support for the moment If you still have a Conviction on this Coin, buy from here with a minimum target of 20%+
Curve DAO CRV price analysis🤑 Did it really happen?) CRYPTOCAP:CRV price has finally “really” come out of the 3-year down trend. A confident breakout, on high volumes, "just like a book says".
💰 Now OKX:CRVUSDT price has hit the mirror level, so we can assume that the correction may be delayed to gain strength to break higher.
A correction in the range of $0.43-0.67 fits into the canons of wave analysis and will not break the structure and growth trend.
And the global 5th wave of growth #Curve DAO token can be expected at least to $4.10-5.50
_____________________
Did you like our analysis? Leave a comment, like, and follow to get more

crvusdt bullish trade idea.CRVUSDT did CHoCH as mentioned on the chart and doing very well. Now coming back to fill remaining liquidity below the previous day low and DEMAND ZONE. In this area we will enter long.

#CRV/USDT#CRV
The price is moving in a descending channel on the 12-hour frame and is sticking to it very well and is expected to break it upwards
We have a bounce from a major support area in green at 0.5250
We have an uptrend on the RSI indicator that was broken upwards which supports the rise
We have a trend to stabilize above the 100 moving average which supports the rise
Entry price 0.3000
First target 0.4000
Second target 0.5071
Third target 0.5071

CRV/USDT PLAN CRV/USDT is currently experiencing a breakout with significant volume. There is a high possibility of a bullish move of 40-80% in the short term. It is advisable to conduct your own research before considering any investment decisions.

CRVUSDTPair : CRVUSDT ( CRV / Tether )
Description :
Completed " 12345 " Impulsive Waves
Resistance Level
Break of Structure and Retracement
Fibonacci Level - 23.80%
Falling Wedge as an Corrective Pattern in Short Time Frame

CRVUSDTPair : CRVUSDT ( CRV / Tether )
Description :
Consolidation Phase in Short Time Frame
Break of Structure
RSI - Divergence
Completed " 12345 " Impulsive Waves
Demand Zone

CRVUSDT 600% PotentialCRVUSDT Technical analysis update
CRV price is consolidating at its major support. We can expect a good bounce from the current level. In the current bull run, CRV could potentially move up by at least 600%.
Buy zone : Below $0.45
Stop loss : $0.30
Regards
hexa

Crypto - CRVPair : CRVUSDT ( CRV / TETHER )
Description :
Completed " 12345 " and " A " Corrective Waves
Break of Structure
Support Level
Consolidation Phase in Short Time Frame and Rejection from Lower Trend Line
RSI - Divergence

CRVUSDPair : CRVUSDT
Description :
Completed " 12345 " Impulsive Waves and " A " Corrective Waves
Higher Highs - Higher Lows
RSI - Divergence
Rising Wedge as an Corrective Pattern in Short Time Frame with the Breakout of Lower Trend Line and Retracement

Curve DAO CRV price perhaps it's time to surprise the hodlers?)Today, we are going to give you a medium- and maybe even long-term idea for the CRVUSDT price to make it easier to follow.
Recently, the CRV price has finally managed to show some growth and break through the trendline.
Now, theoretically, price may be testing trend line "strength".
If everything goes well, and the CRVUSD price is not allowed to fall below the critical level of $0.50 , then there is a chance for growth.
The minimum upside target is $1.30 per CRV
The maximum target (with the current input data) is around $2.50
Fundamentally, the Curve Dao project is strong, the creator has a mathematical mindset, if only he had a team of marketers like memecoins, then everything would go where it should)

#CRV#CRV
The price is moving in a descending channel and this channel has been strongly breached upwards.
We have higher stability to move at 100. And we have an uptrend on the index. RSI.
Entry PRICE. 0.5833.
First target 0.6192.
Second goal 0.6800
Third goal. 7477

CRV/USDT Short TermHello, We've seen CRV/USDT ranged between $0.442 - $0.484 for almost two weeks. With the trade volume slightly decreasing and the RSI(14) levels appearing in the resistance zone, I expect the CRV/USDT pair to retreat to the support zone within this range.
Short Term:
Short Trigger: $0.484
Stop Limit: $0.510
Take Profit: $0.442
