USDCHF SupportAfter profit on short trade ( Yesterday high of the market ) Today i will waiting for natural correction on my long level. Stoploss is set on the lowest volume of the movement. Happy Trading
Dale
Crypro

BCN/BTC LONG BCN I observed the 4h frame and it is accumulating quite well to prepare for the new rebound, stronger than the previous times:
BCN buy : 78-80SAT
Sell : 1st 96sat
sell 2st : 100-122sat .

Btc Bullish 2h 10/20/50 EMA CrossOver Possible Change In Trend As the title states we have a bullish crossover on the 2h chart even the 50 EMA was crossed over now
i will update a little later we need more data on a longer time frame i will update the post below
tomorrow once we get a little more data we are about to cross over 10/20 ema on the 4hr chart
things are looking rather bullish.(Wait for confirmation)
If you read my posts during the week and mainly the past 2 days you would see the bears are just
about done look at the long term MACD i mean really long term since this bullish momentum started
believe it or not the bears have mostly been in control. Well it looks like they have really ran out
of steam they have had too much control over this market for a long time now and the bulls have
been patient in how they played this one i have watched it every day for the past 6 months if not
longer.
I know we have been up and down lately and i don't want to explain myself over and over but looking
at all the indicators and trending patterns we should have full confirmation of a change in trend
soon maybe a day or two depends on how much sideways movement there will be, i think this is going
to be a game changer and the main reason being is we have started a small uptrend and it looks
strong the RSI looks good the Macd is good there are multiple crossovers coming up on many
of the charts, one more thing to note is the lower low eventually happened and this is what most
traders have been waiting for.
Now i did say that my bottom was $7200 along time ago we may have breached that a little but
if you look where people bought in you will see that most sold for a profit to buy back in they
where all talking about it last night mostly the whales.
Now you see the shilling that is going on that alone is good news do not let people make decisions
for you do it for yourself use your own TA patients will pay off do not listen to people bashing
btc because it retraced more than everyone thought it would.
And good luck i will keep this updated over the next few days.But it is a good sign trust me there
are people that were starting to lose faith even me for a few hours last night but i can see this
being a good sign.We need more data so wait for confirmation and wait for longer time frame
cross overs people are buying and it is restoring faith in the bitcoin market again.don't let the
'SHILLS GET YOU DOWN' they only arrive when a change in trend is coming MGPC will be posting
soon.


RIPPLE Selling SetupThere is a potential selling opportunity here. The price going down last few hours, but if it goes up at resistance level (0.7051), this will create a selling setup. The price respected that level many times and it will more likely, it will do again. The new selling orders will be placed at that resistance level, that push the price down.

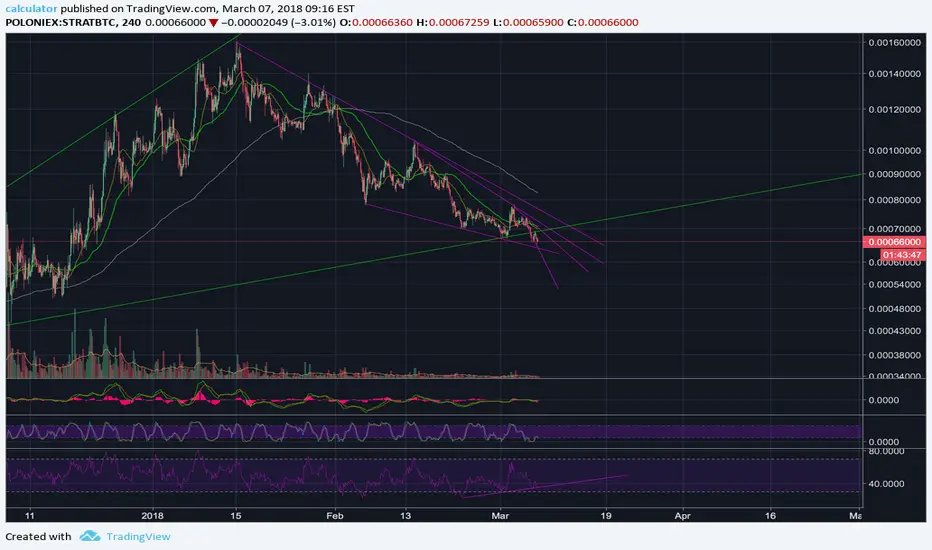
STRAT hidden RSI divergenceSTRAT did we find the bottom? In the RSI you are showing a hidden divergence.
Lets see how you play this out.
BTC possible inverted ABC correction?We did 5 waves in this downtrend dating back from the 20K top in December. If BTC manage to stay in the falling wedge there is a good chance that this is the inverted ABC correction with possible breakout around 20/26 February(After Chinese lunar year celebration on 16 February).
Corrections like this are healthy for the crypto market, bud on the long run this is clearly a bullish revolutionary market.
Did you see the buy volume last days when we touched the 6K? Strong buys activated when price hit that zone!
Target: 11.300 USD if the market goes FOMO we can see the breakout here otherwise we will do a possible double bottom.
Thanks for watching to my idea.

